


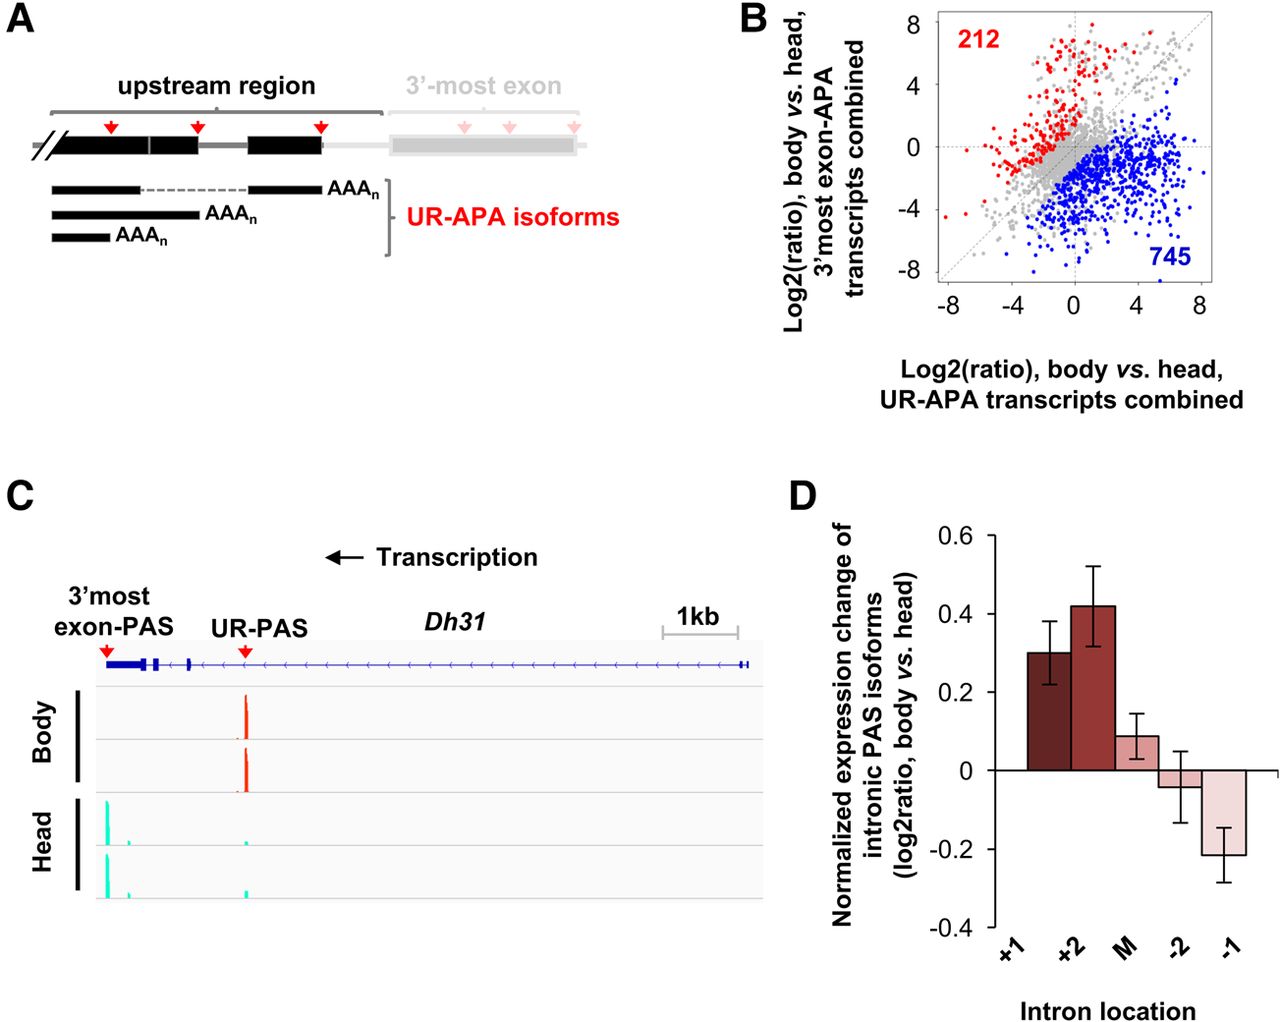
Upstream region APA difference between fly body and head. (A) Scheme showing various upstream region (UR)-APA isoforms. (B) Scatter plot comparing abundance of UR-APA isoforms and 3′-most exon APA isoform in body vs. head. Genes with significantly higher abundance of UR-APA isoforms in body compared to head are shown in blue (745 genes). Those with higher abundance of 3′-most exon PAS isoforms in the body vs. head are shown in red (212 genes). Two biological replicates were used. Significance of APA was based on the DEXseq analysis (FDR < 0.05). (C) UCSC snapshot of 3′READS data for Dh31, showing that an UR-PAS isoform is preferentially expressed in bodies while 3′-most exon PAS expression is biased to heads. (D) Introns were divided into first (+1), second (+2), last (−1), second to last (−2), and middle (between +2 and −2 introns) groups. Only genes with ≥4 introns were analyzed, and only PASs with ≥5 reads were selected. Expression changes are log2(ratio) of PAS reads in test sample vs. control sample. Values for five intron groups were normalized by mean-centering. Error bars are SEM.




