


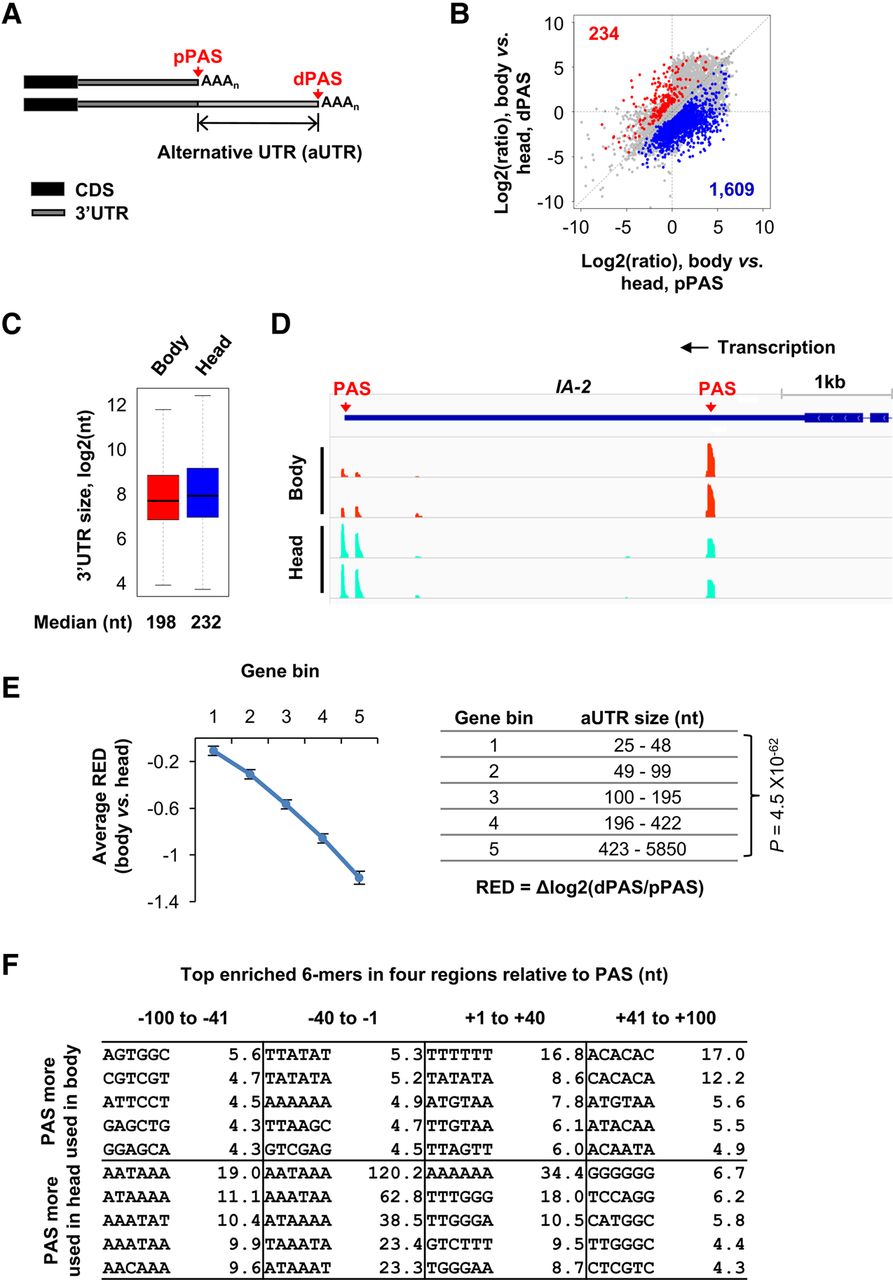
3′UTR-APA difference between Drosophila melanogaster body and head. (A) Scheme showing 3′UTR-APA and its analysis. Top two most abundant PAS isoforms per gene were selected for comparison, which are named proximal PAS (pPAS) and distal PAS (dPAS) isoforms, respectively. The distance between the two PASs is considered alternative 3′UTR (aUTR). (B) Scatterplot showing pPAS and dPAS isoform abundance differences between head and body. Two biological replicates were used. Genes with significantly (FDR < 0.05, DEXseq analysis) higher abundance of pPAS isoforms in the body vs. head are shown in blue (1609 genes), and those with higher abundance of dPAS isoforms are in red (234 genes). Total numbers of blue and red genes are shown. (C) Box plot of the 3′UTR length for genes with expression in body and head samples. The weighted mean based on multiple APA isoforms was used to calculate the 3′UTR size of expressed transcripts of each gene. The median value is indicated. (D) UCSC snapshot of 3′READS data for IA-2, showing that pPASs are preferentially expressed in fly bodies while dPASs are in heads. Two replicates are shown. (E) Relationship between the extent of 3′UTR-APA difference and aUTR size. Expressed genes with 3′UTR-APA were evenly divided into five bins based on the aUTR size (distance between pPAS and dPAS), resulting in ∼1300 genes in each bin. The aUTR size range for each bin is shown in the table next to the graph. The extent of 3′UTR-APA difference is represented by relative expression difference (RED), which is the difference in log2(ratio) of dPAS isoform abundance to pPAS isoform abundance between body and head. Error bars are SEM. Values for genes in bin #1 were compared with those in bin #5 by the Wilcoxon rank sum test, and the P-value is shown. Only PASs with ≥5 reads were used for analysis. (F) Top enriched 6-mers in four regions around the PASs up-regulated in body (top) or in head (bottom). Values are −log10(P), where P is based on the Fisher's exact test.




