


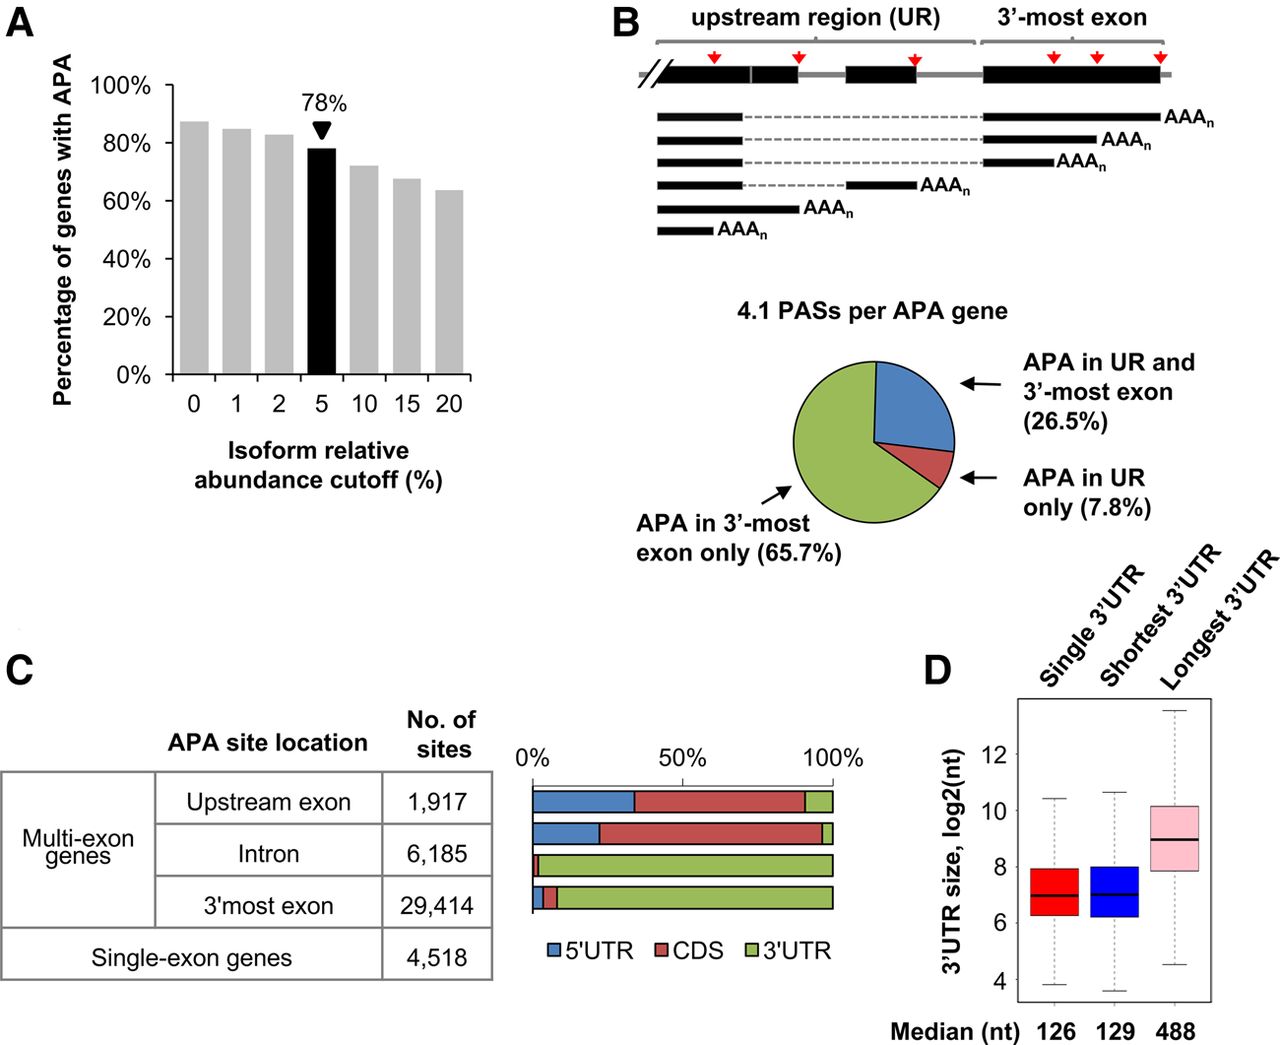
APA in Drosophila melanogaster. (A) Percentage of protein-coding genes in the fly genome found to express APA mRNA isoforms using isoform expression cutoffs. At 5% relative abundance cutoff, 78% of fly mRNA genes displayed APA with 4.1 PASs per gene. (B) (Top) Scheme of the different APA types. APA sites are divided into two groups, i.e., 3′-most exon and upstream region (UR). (Bottom) Percentage of genes with APA sites in upstream regions (UR) and/or 3′-most exons. Only genes with APA sites were included. (C) mRNA regions affected by APA. Genes were divided into multiexon or single exon groups. The former was further divided into upstream exon (non-3′-most), intron, and 3′-most exon groups. The number of PASs in each group is indicated. mRNA regions were separated into 5′UTR, coding sequence (CDS), and 3′UTR. For intronic PASs, the mRNA region affected was defined by the exon immediately upstream of the PAS. (D) The 3′UTR size of transcripts from genes without APA sites (single 3′UTR) or with APA sites (shortest and longest isoforms are shown).




