


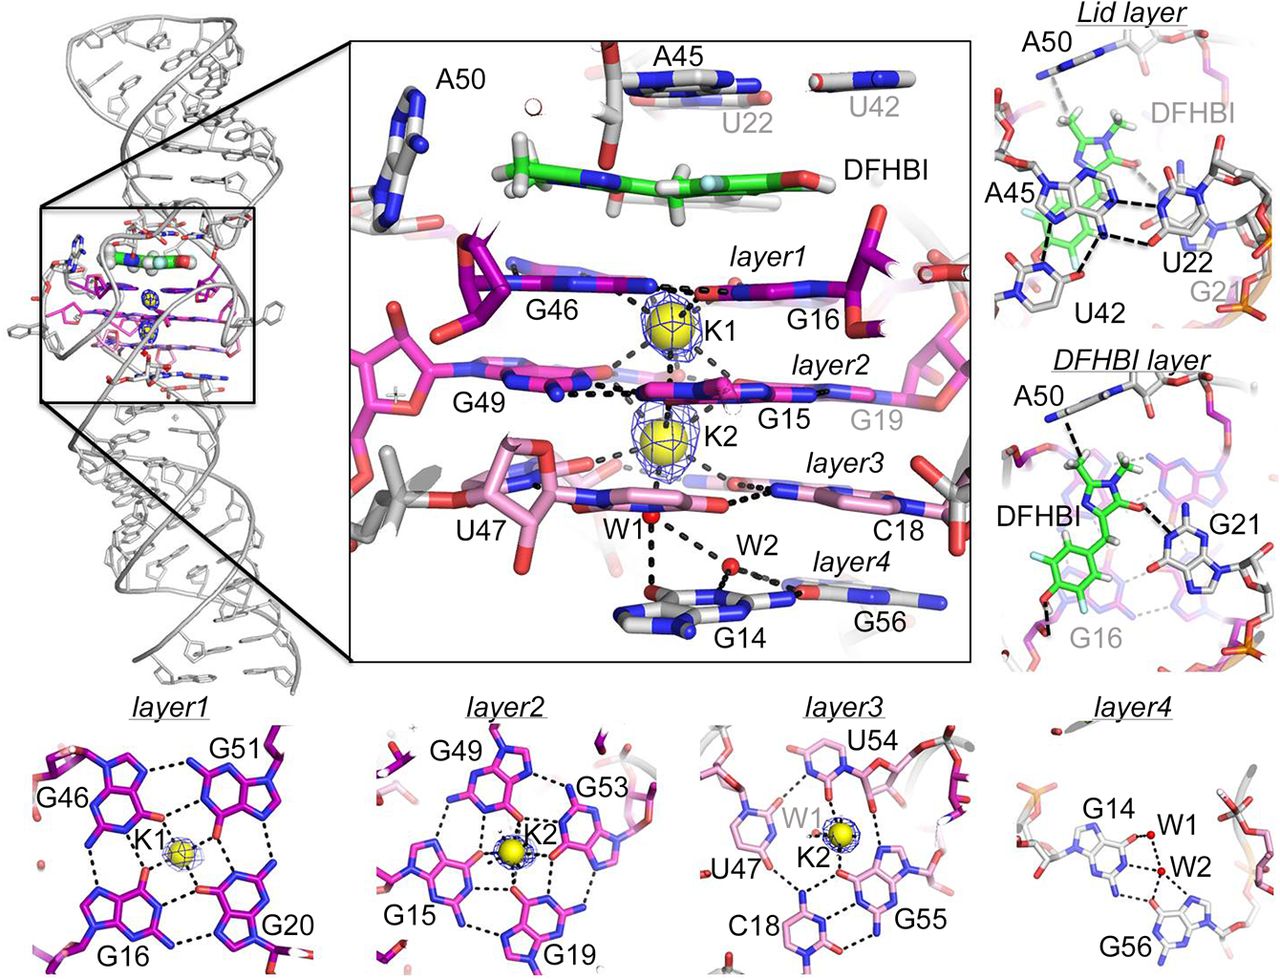
iSpinach crystallographic structure. The crystal structure of iSpinach-D5-G30–A32 is shown in light gray (top left) together with a zoom on the core region of the molecule involved in DFHBI binding. The ligand DFHBI is colored in green. The quartet motif is in magenta from dark magenta in layer 1, magenta layer 2, and light magenta layer 3. Potassium ions are represented by yellow spheres and the anomalous differential electronic density maps (Fo–Fc at 6.0 σ level) are shown as a blue mesh around the spheres. The interactions are represented by black dashed lines. The waters are represented by red dots. All the zoomed layers are shown perpendicular to the helical axis as well.




