


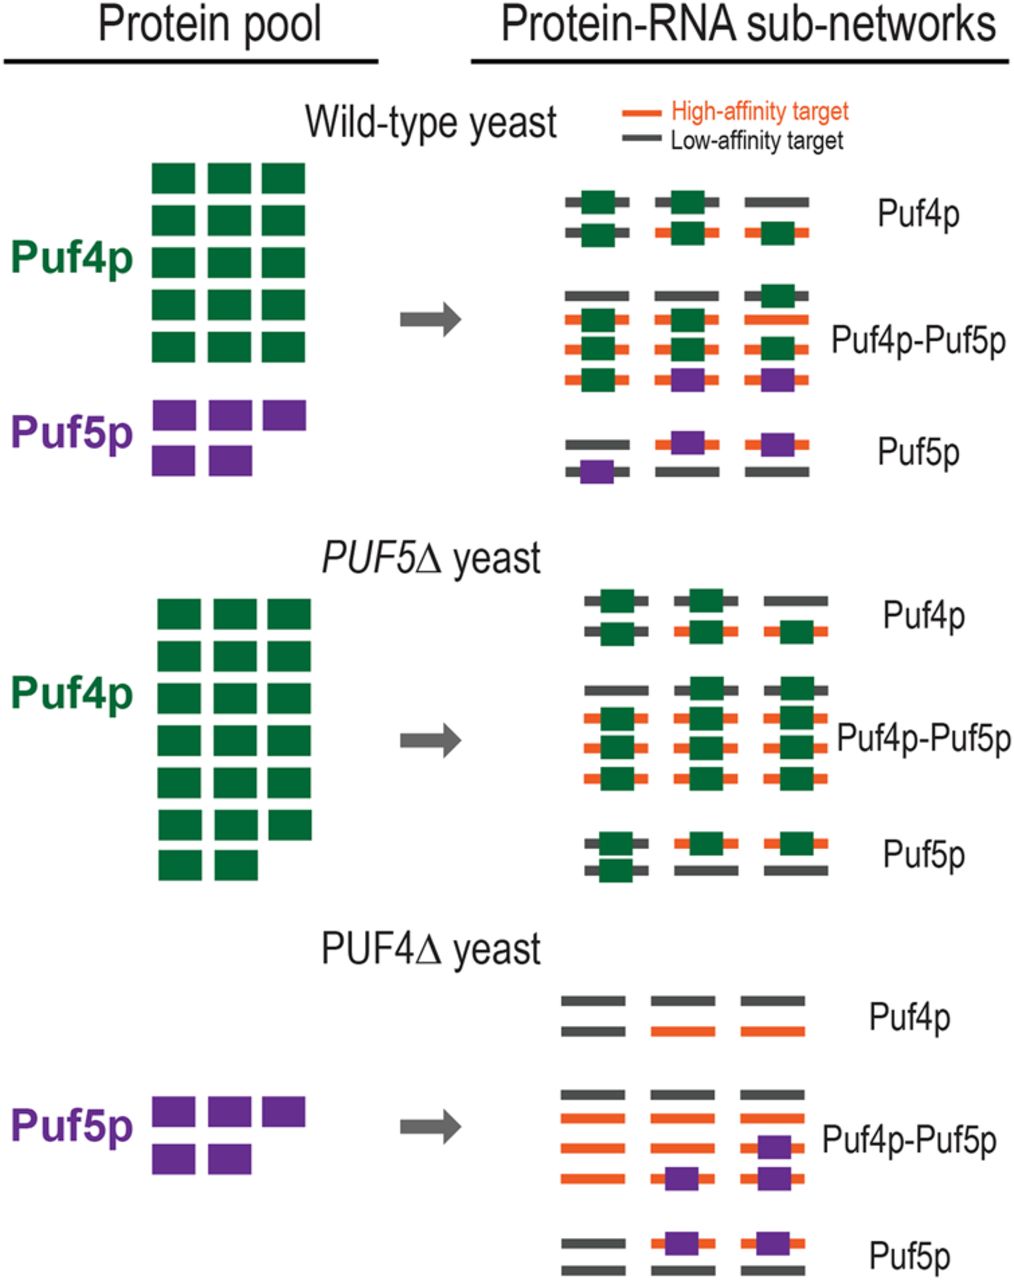
FIGURE 7.
Proposed model for the expansion and contraction of subnetworks upon loss of a single protein. Green squares indicate Puf4p, and purple squares indicate Puf5p. Orange lines indicate a target with a high-affinity binding element, and gray lines indicate a target with a low-affinity binding element.




