


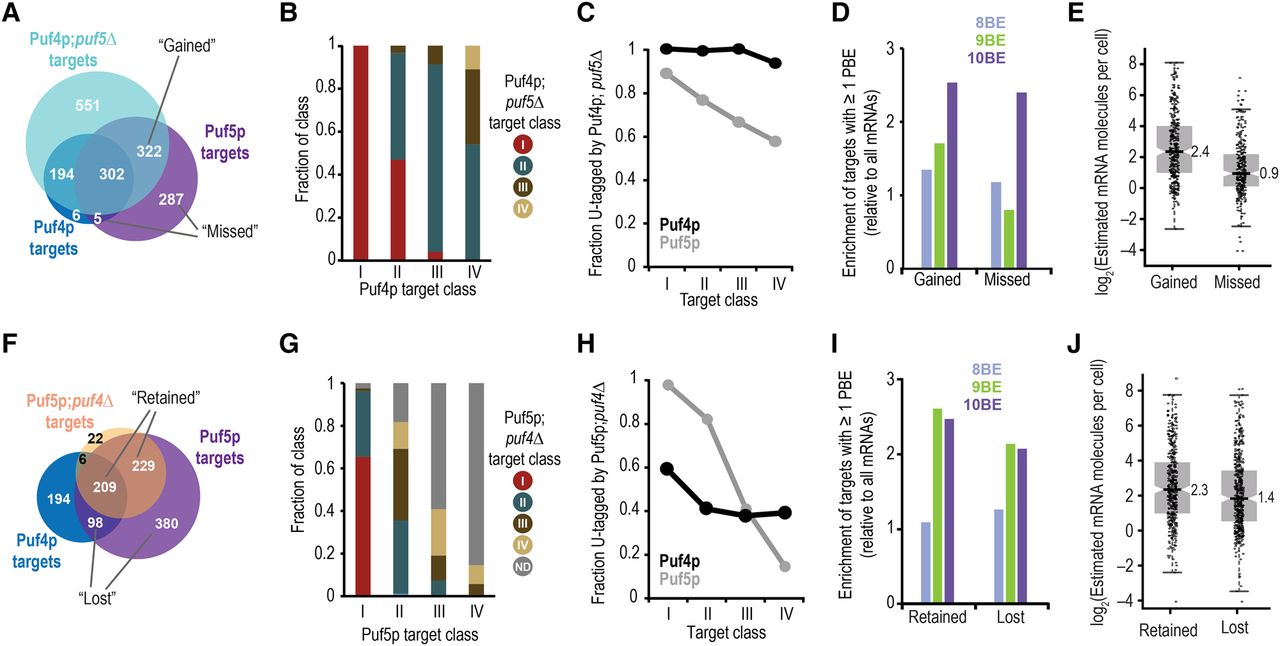
Rewiring of the super-network absent one component: divergent effects. (A,F) Proportional Venn diagram illustrating overlap among the indicated targets. (B,G) Plot of the fraction of the indicated target class that was present in the indicated Puf4p;puf5Δ (B) or Puf5p;puf4Δ (G) target class. For example, in panel B, all class I Puf4p targets were class I Puf4p;puf5Δ targets, and ∼45% class II Puf4p targets improved to class I Puf4p;puf5Δ targets while ∼55% class II Puf4p targets remained class II Puf4p;puf5Δ targets. (C,H) Plot of the fraction of each class of Puf4p (black) and Puf5p (gray) targets that were U-tagged in Puf4p;puf5Δ (C) or Puf5p;puf4Δ (H) yeast. (D,I) Enrichment of the indicated groups, defined in panels A and F, of genes for 8BEs, 9BEs, and 10BEs relative to all yeast mRNAs (all mRNAs). (E,J) Boxplot illustrating the estimated number of mRNA molecules present in each yeast cell for the indicated groups of mRNAs, defined in panels A and F. The individual data points for each gene and medians are overlaid on the boxplot.




