


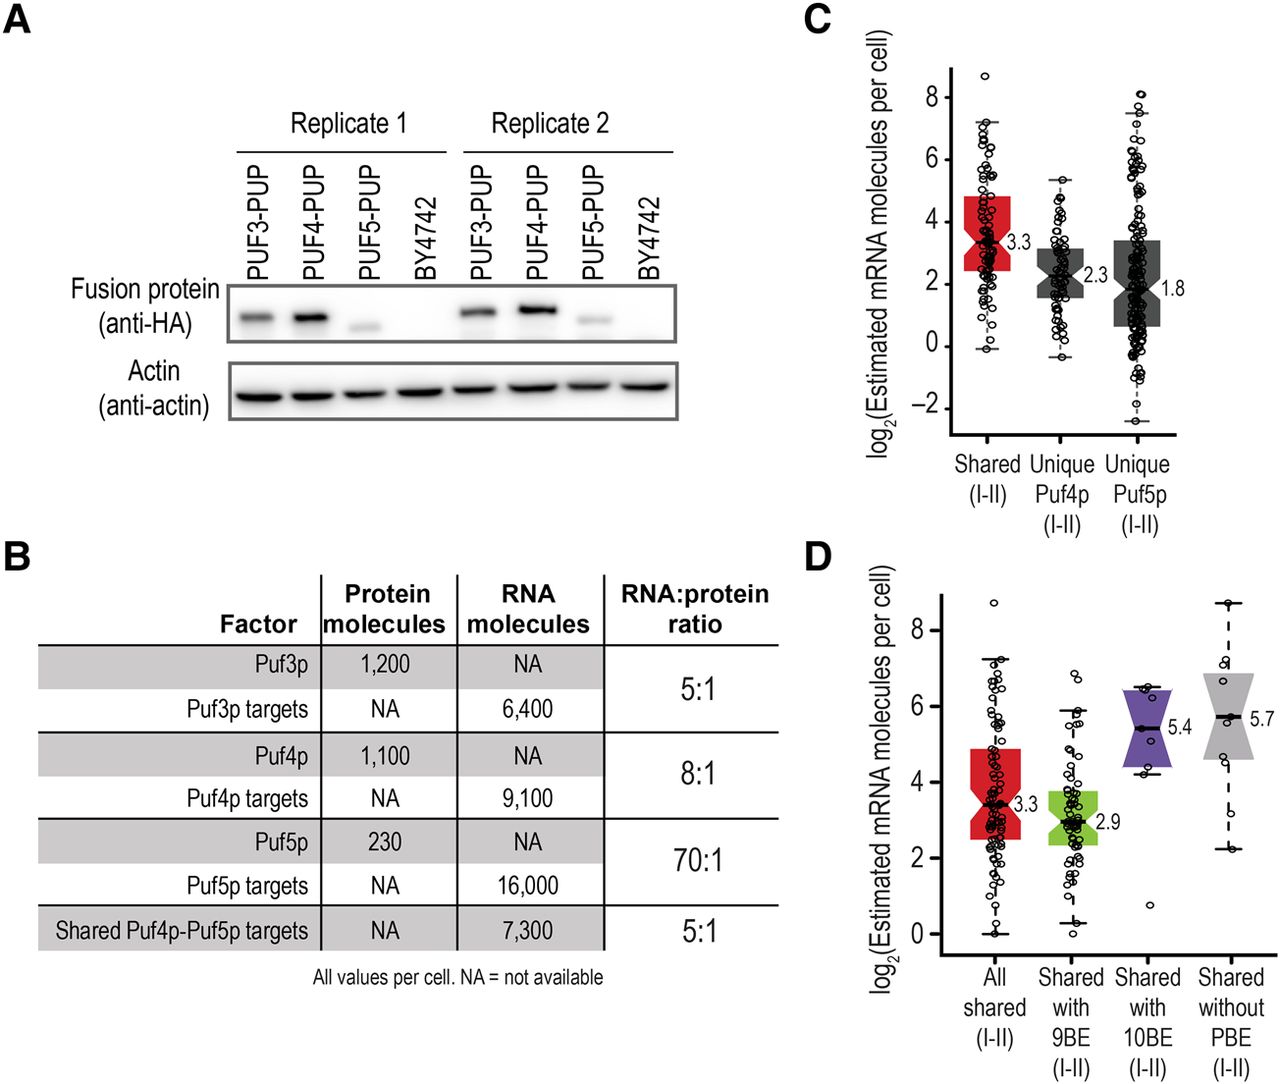
Relative abundance of Puf4p, Puf5p, and their targets. (A) Western blot depicting relative protein levels of the indicated strains. PUF4–PUP and PUF5–PUP contained 3-HA epitope tags on their C termini. Actin was used as the loading control. (B) Estimated number of molecules present in a cell for Puf3p, Puf4p, Puf5p, and their mRNA targets. The estimated number of Puf3p, Puf4p, and Puf5p molecules were obtained from Kulak et al. (2014). The estimated number of mRNA molecules was calculated using our published RNA-seq data (Lapointe et al. 2015) and an estimated total number of 36,000 molecules of mRNA per cell (Miura et al. 2008). In the calculation of the RNA:protein ratio for shared Puf4p–Puf5p targets, the total number of proteins was the sum of Puf4p and Puf5p (1330). Ratios were rounded to the nearest integer. (C) Boxplot illustrating the estimated number of mRNA molecules present in each yeast cell for the indicated groups of mRNAs. The individual data points for each gene and medians are overlaid on the boxplot. “Unique Puf5p (I–II)” refers to RNAs that were uniquely U-tagged by PUF5–PUP and were present in class I or II. “Unique Puf4p (I–II)” refers to RNAs that were uniquely U-tagged by PUF4–PUP and were present in class I or II. “Shared (I–II)” refers to mRNAs U-tagged by both PUF4–PUP and PUF5–PUP and were present in class I or II of both data sets. (D) Boxplot illustrating the estimated number of mRNA molecules present in each yeast cell for the indicated groups of mRNAs. The individual data points for each gene and medians are overlaid on the boxplot. “Shared (I–II)” is defined as mRNAs U-tagged by both PUF4–PUP and PUF5–PUP and were present in class I or II of both data sets.




