


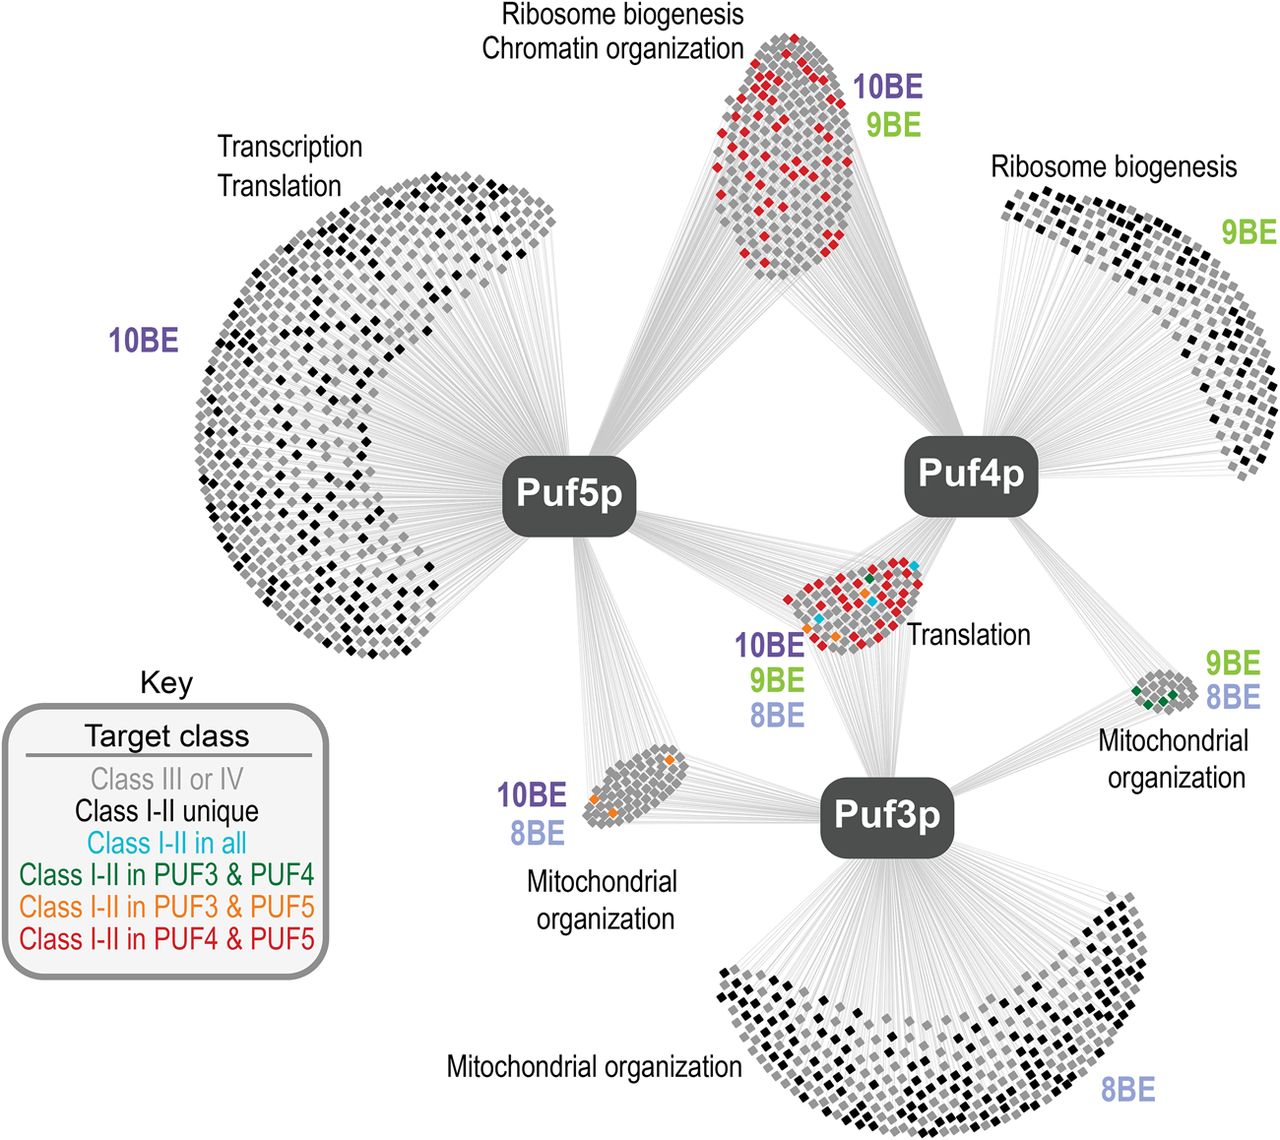
FIGURE 4.
Map of the canonical PUF super-network in S. cerevisiae. Each box represents a single gene, and lines illustrate if it was U-tagged by a given PUF protein. The key indicates how genes were colored. PBEs enriched above background and broad Gene Ontology enrichments in different groups of targets are indicated.




