


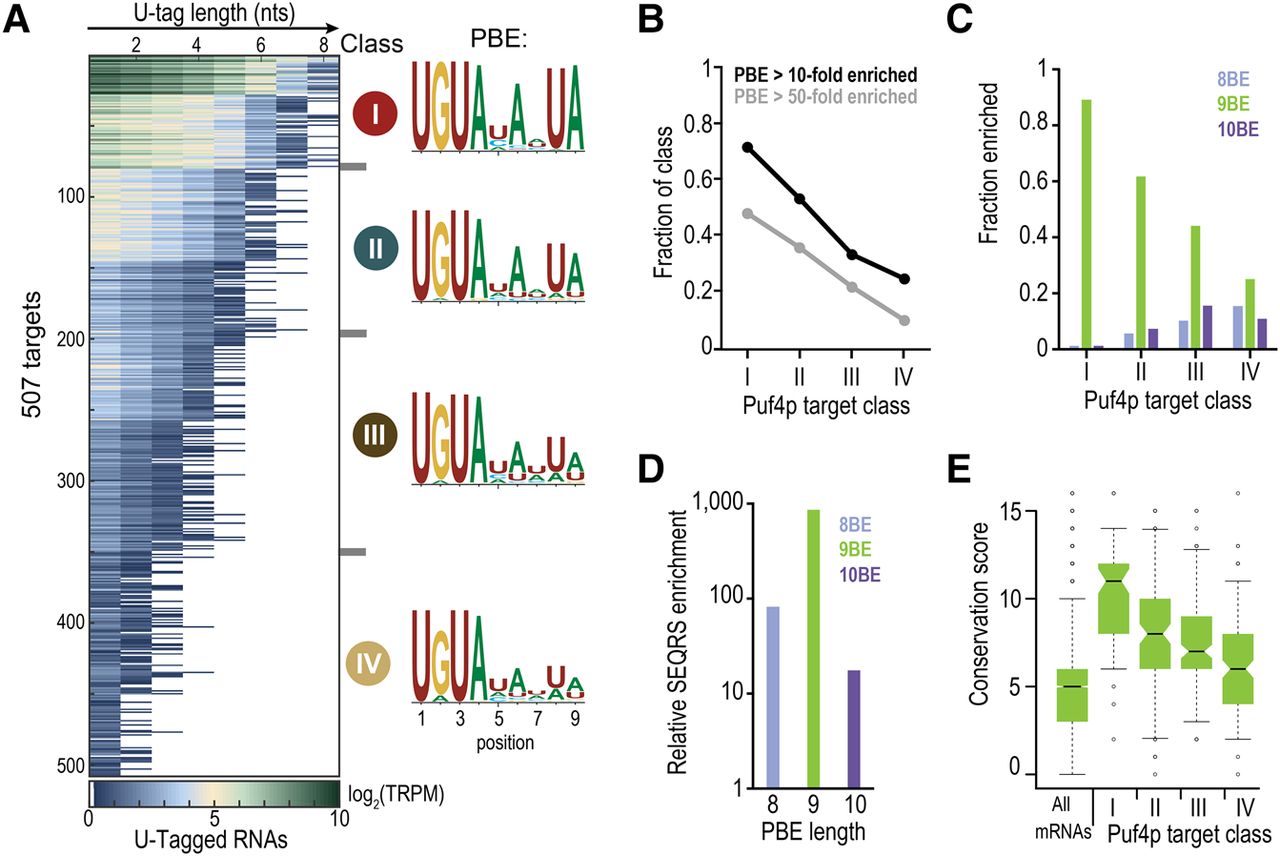
The Puf4p subnetwork was identified via RNA Tagging. (A) Heat map displaying results of the k-means clustering analysis of all 507 Puf4p targets. Each row represents a single Puf4p target. Columns refer to the length of the U-tag detected on reads for each gene, from at least one uridine (leftmost column) to at least eight uridines (rightmost). Puf4p target classes are indicated (I, II, III, and IV). The average PBE enriched in each class of targets is also indicated with the y axis, in bits. (B) Plot showing the fraction of each Puf4p target class with PBEs enriched at least 10-fold (black) or 50-fold (gray) above background in SEQRS. (C) Plot of the enrichment of each class of Puf4p targets for 8BEs, 9BEs, and 10BEs. (D) Plot of SEQRS enrichment of Puf4p binding to 8BE, 9BE, and 10BEs in vitro. Enrichment for each PBE was calculated relative to randomers of the same length. (E) Box plot of 9BE conservation scores for all yeast mRNAs (all mRNAs) and Puf4p target classes. A score of “16” indicates the 9BE was present in all 16 species that were analyzed.




