


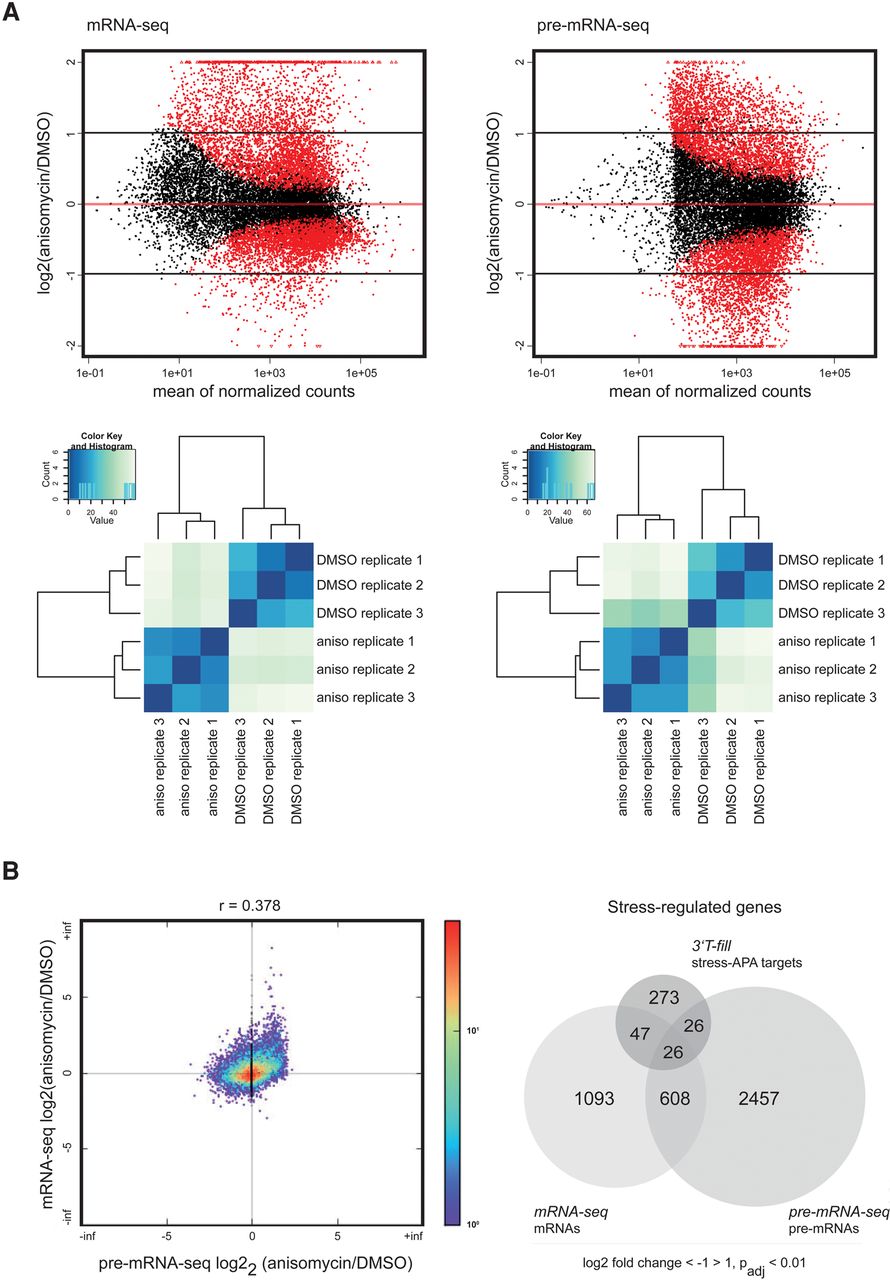
Post-transcriptional mechanisms extensively influence gene expression under stress. (A) Scatterplots displaying RNA-seq data show expression changes of mRNA and pre-mRNA following stress (upper panels). Significantly stress-regulated genes are displayed as red dots (Padj ≤ 0.01). Genes with fold changes off the scale are shown as triangles. Only at least twofold up- or down-regulated genes (log2 fold-change ≥ 1 or ≤ −1) were considered for further analyses. Fold-change cutoffs are displayed as black lines. Hierarchical clustering illustrates that triplicates of mRNA-seq and pre-mRNA-seq data group according to treatment (anisomycin [“aniso”] versus control DMSO treatment) (lower panels). The histograms and the accompanying dendrograms display the sample-to-sample distances (Euclidean distances) between the samples which were calculated from the read counts after log transformation. (B) Scatterplot correlating the stress response on the pre-mRNA and the mRNA levels of coding and noncoding genes (left panel). Colors indicate the number of overlapping data points. Pie chart comparing absolute numbers of stress-APA targets and stress-regulated mRNAs and pre-mRNAs (right panel).




