


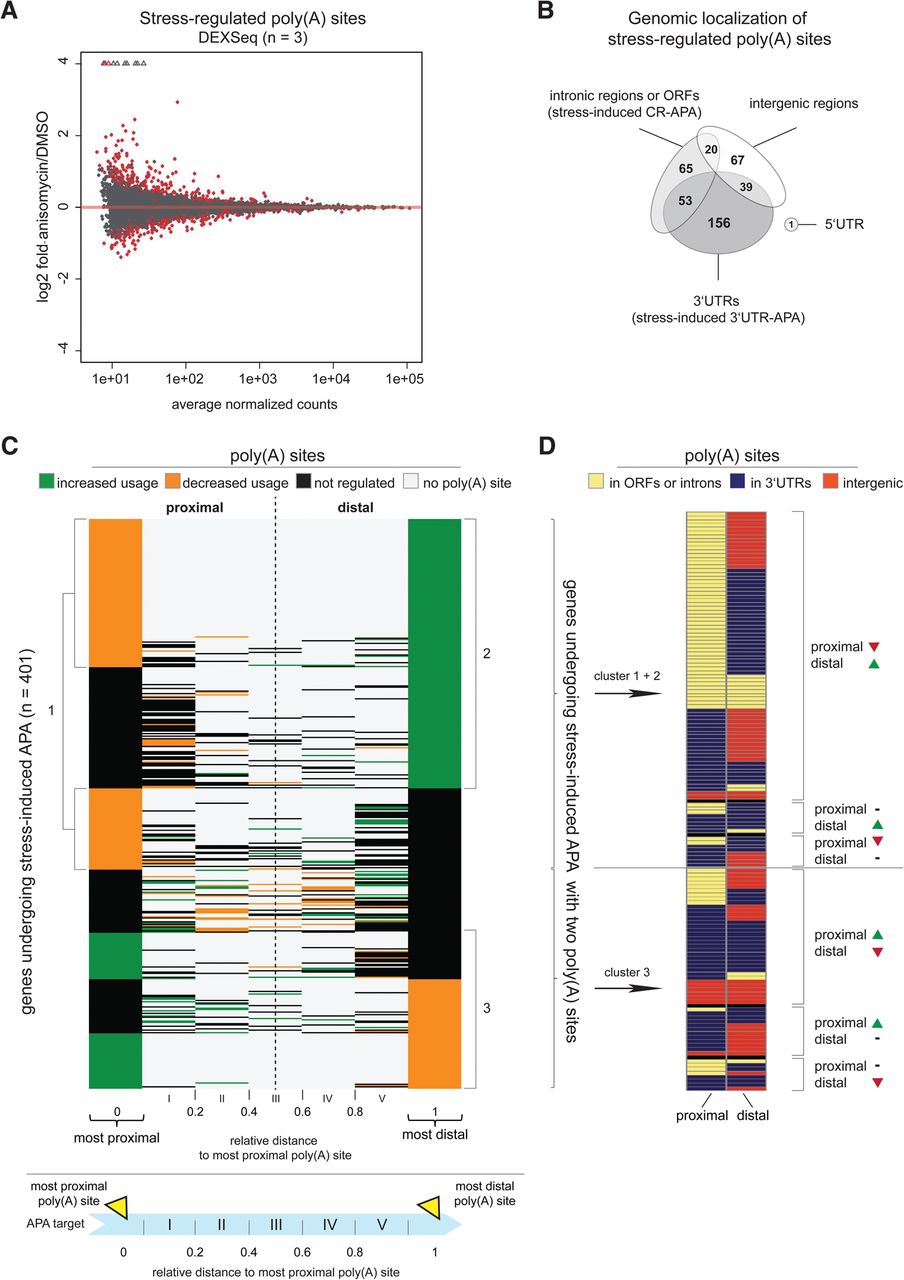
Stress induces alternative polyadenylation in a large number of RNAs and globally leads to the increased usage of distal and the decreased usage of proximal poly(A) sites. (A) DEXSeq analysis displaying stress-regulated poly(A) sites as detected in 3′T-fill [significantly regulated poly(A) sites are represented as red dots; Padj < 0.1]. 3′T-fill analyses were performed on three independent biological replicates. (B) Venn diagram displaying genes with at least one stress-regulated poly(A) site and the distribution of these sites across different genomic regions, including intronic regions or open reading frames (ORFs) and 3′UTRs, stimulating coding-region (CR-) and 3′UTR-APA, respectively, as well as 5′UTRs and intergenic regions. (C) The gene region between the most proximal and the most distal poly(A) site was separated into five equal sections I–V and scanned for poly(A) sites (see cartoon beneath). In this way, poly(A) sites lying between the most proximal and the most distal poly(A) site could thus be classified as “proximal” or “distal” depending on their relative distance to the most proximal poly(A) site. The heat map displays the stress-dependent regulation of the utilization of all poly(A) sites on an individual gene basis. Poly(A) sites showing a stress-induced increased usage are shown in green, poly(A) sites with decreased usage are depicted in orange, and poly(A) sites that were not stress-dependently regulated are displayed in black. The data were ordered according to the regulation of the most distal poly(A) site. APA targets were enriched for genes with down-regulated usage of their most proximal poly(A) site (cluster 1) and increased usage of their most distal poly(A) site (cluster 2). Genes that showed the opposite regulation of poly(A) site usage with increased utilization of the proximal and decreased utilization of the most distal poly(A) site were grouped into cluster 3. (D) The regulated poly(A) sites of the cluster 1 and 2 genes, which showed decreased proximal and/or increased distal poly(A) site usage, as well as for the cluster 3 genes, which showed the opposite trend, were categorized according to the genomic region they occurred in. For simplicity, only genes with two poly(A) sites were considered in this analysis. Poly(A) sites lying in introns or ORFs are shown in yellow, those lying in 3′UTRs are depicted in dark blue, and those occurring in intergenic regions are shown in dark orange.




