


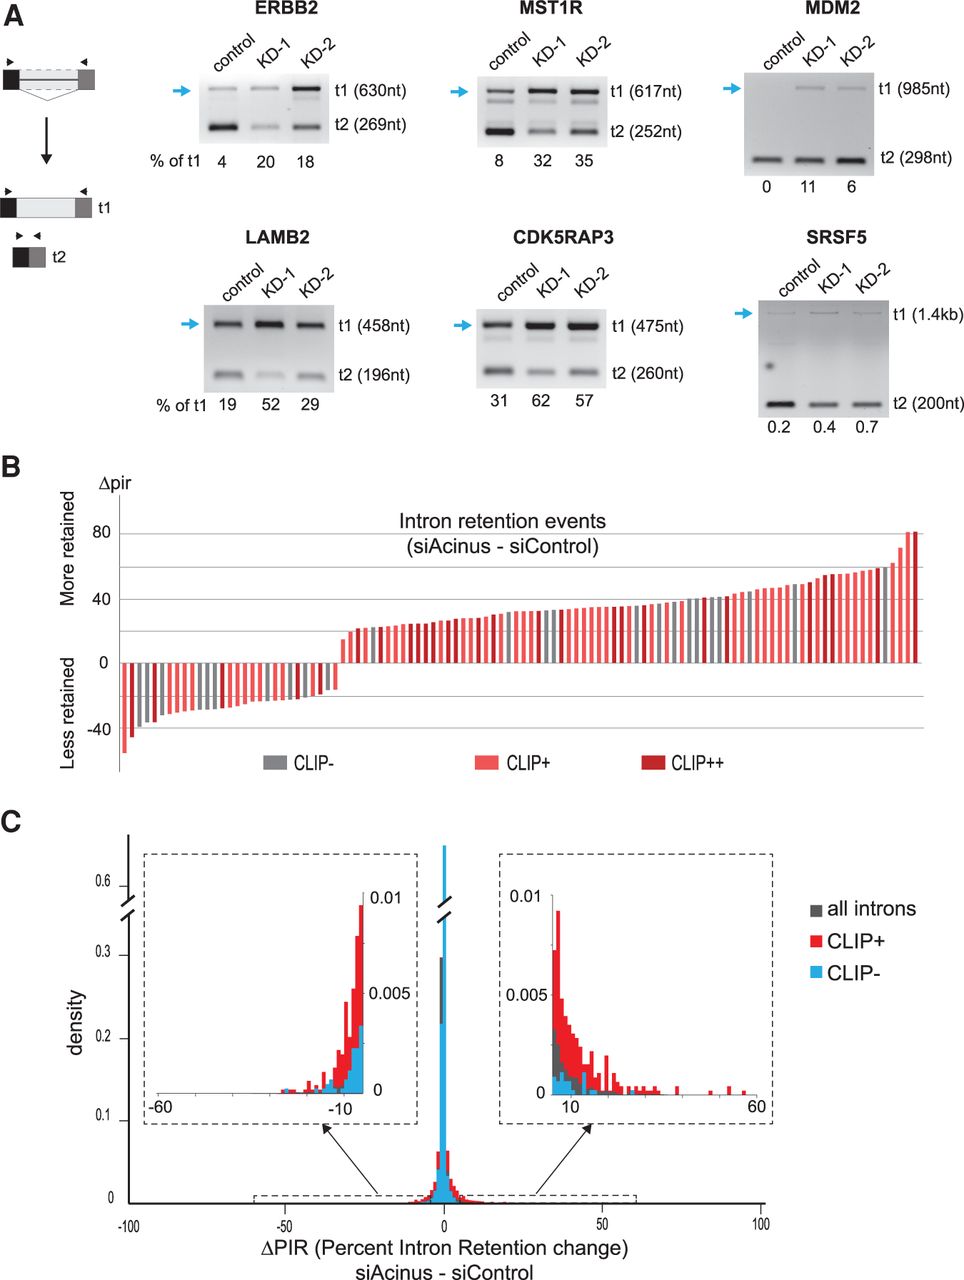
Intron retention changes mediated by Acinus. (A) Validation of intron retention changes for the ERBB2, MST1R, MDM2, LAMB2, CDK5RAP3, and SRSF5 transcripts in Acinus-depleted cells using two distinct siRNAs. The blue arrow indicates the isoform showing an increase in Acinus-depleted cells. The proportion of transcript t1, corresponding to the longest isoform, was estimated after quantification of the transcript's abundance by an Agilent Bioanalyzer. (B) Plot showing the Δpir (difference of intron retention level) for the intron retention events. Introns bound by Acinus are in red (CLIP+: in two out of three Acinus iCLIP and CLIP++: in all three iCLIP experiments). (C) Histogram showing the density of introns depending on their change in intron retention level (Δpir) in the RNA-seq data. The analysis was done on introns with reliable intron retention levels: 89,752 for all introns, for 4557 CLIP+ introns, and for 4461 CLIP− introns. The inside panels are zoomed-in views of the plot for a Δpir in the ranges (−60, −5) and (5:60).




