


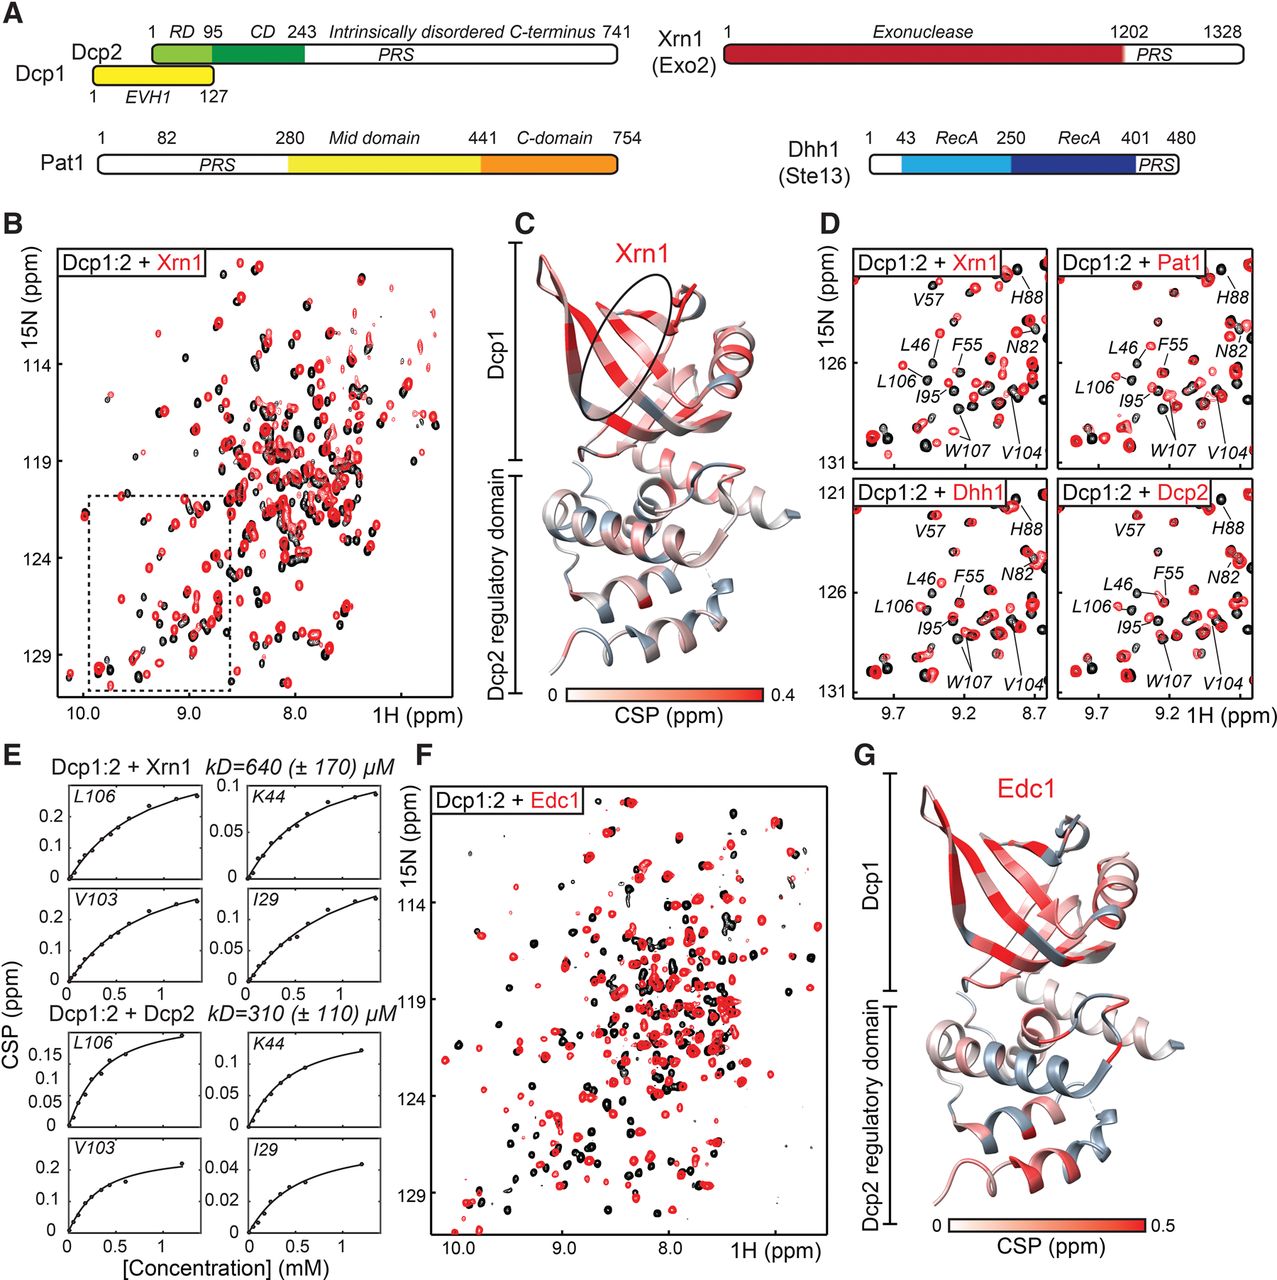
(A) Schematic representation of the proteins used in this study. (B) 1H-15N NMR spectrum of the S. pombe Dcp1:Dcp2RD in the absence (black) and presence (red) of Xrn1 (1201–1328). CSPs report on the interaction between Xrn1 and Dcp1:Dcp2. (C) CSPs that Xrn1 induces in the decapping complex mapped on the structure of the complex (2QKM). Affected residues are colored red, unaffected residues white, and unassigned residues gray. The black oval indicates the aromatic groove in Dcp1. (D) CSPs induced in the decapping complex upon interaction with Xrn1 (1224–1257), Pat1 (159–226), Dhh1 (401–419), and the C-terminal region of Dcp2 (269–312). The spectral region shown corresponds to the boxed area in B. (E) NMR titration experiments that quantify the interaction strength between the Dcp1:Dcp2RD decapping complex and Xrn1 (top, residues 1224–1257) or the Dcp2 C-terminal region (bottom, residues 269–312). The extracted affinity between the Xrn1 PRS and Dcp1 is based on 17 Dcp1 resonances that experience significant CSPs. The extracted affinity between the Dcp2 PRS and Dcp1 is based on nine Dcp1 resonances that experience significant CSPs. (F) 1H-15N NMR spectrum of the Dcp1:Dcp2RD in the absence (black) and presence (red) of S. pombe Edc1 (144–181). Note that the number of CSPs is larger than observed for the interaction between the decapping complex and Xrn1 (see B), indicating a larger binding interface. (G) CSPs induced by the Edc1 interaction with Dcp1:Dcp2 plotted on the structure of the decapping complex. Note the CSPs that we observed in the regulatory domain of Dcp2.




