


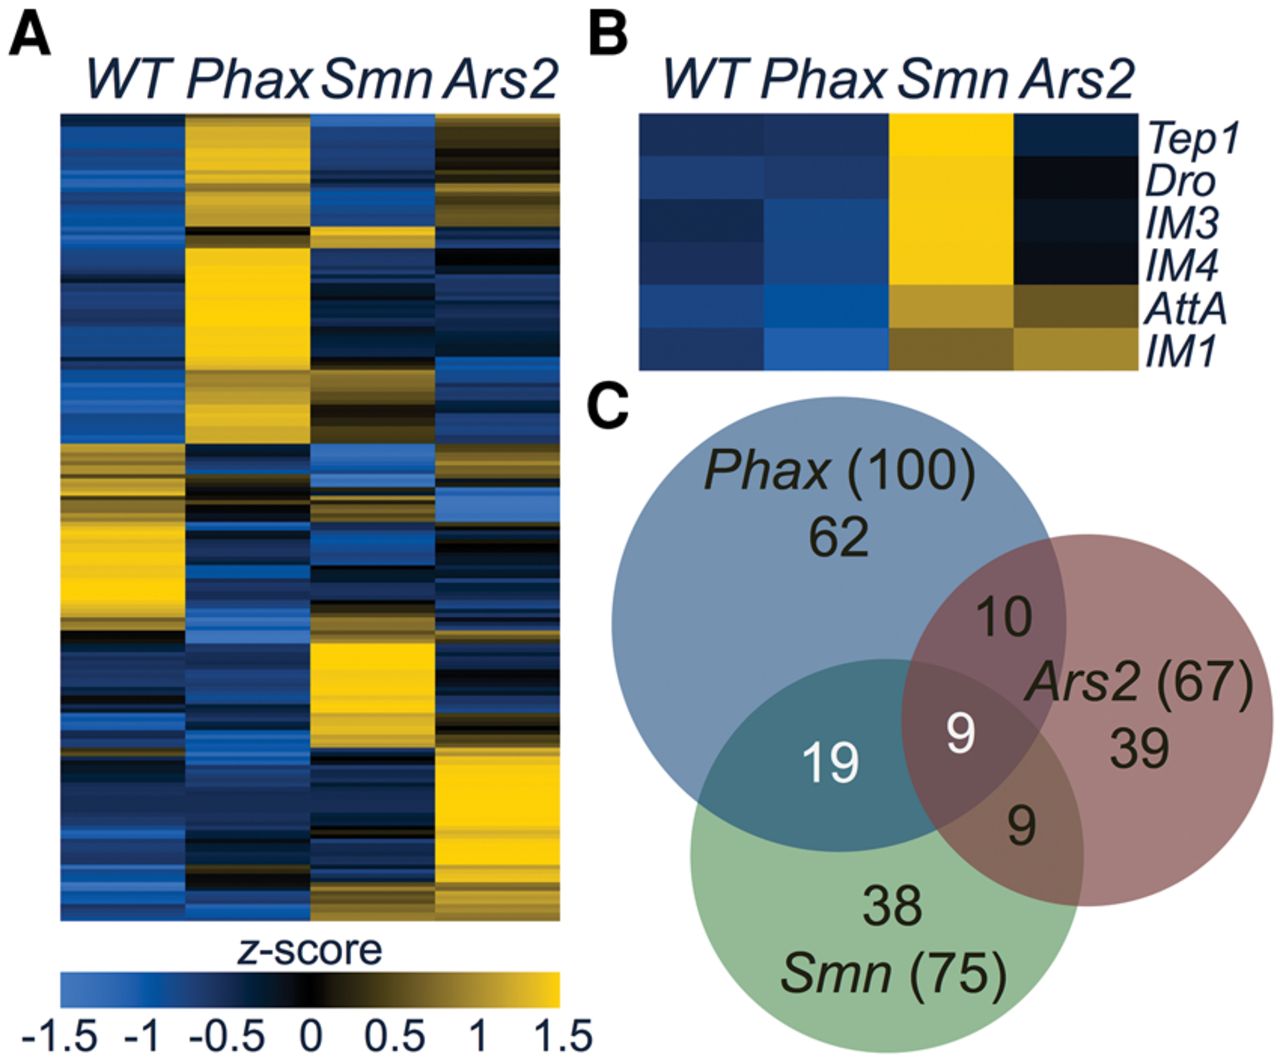
FIGURE 2.
Gene expression differences in snRNP biogenesis mutants. (A) Heatmap comparison of Cuffdiff FPKM levels of differentially expressed transcripts. Heatmap colors were rescaled for each row and the rows were clustered based on pattern of gene expression between WT and mutants. (B) A heatmap of FPKMs from a set of stress-responsive transcripts in A. (C) Venn diagram of the overlap in gene expression differences in the snRNP biogenesis mutants. Phax = PhaxSH/SH, Smn = SmnX7/D, and Ars2 = Ars2C/E. Numbers in parentheses are totals.




