


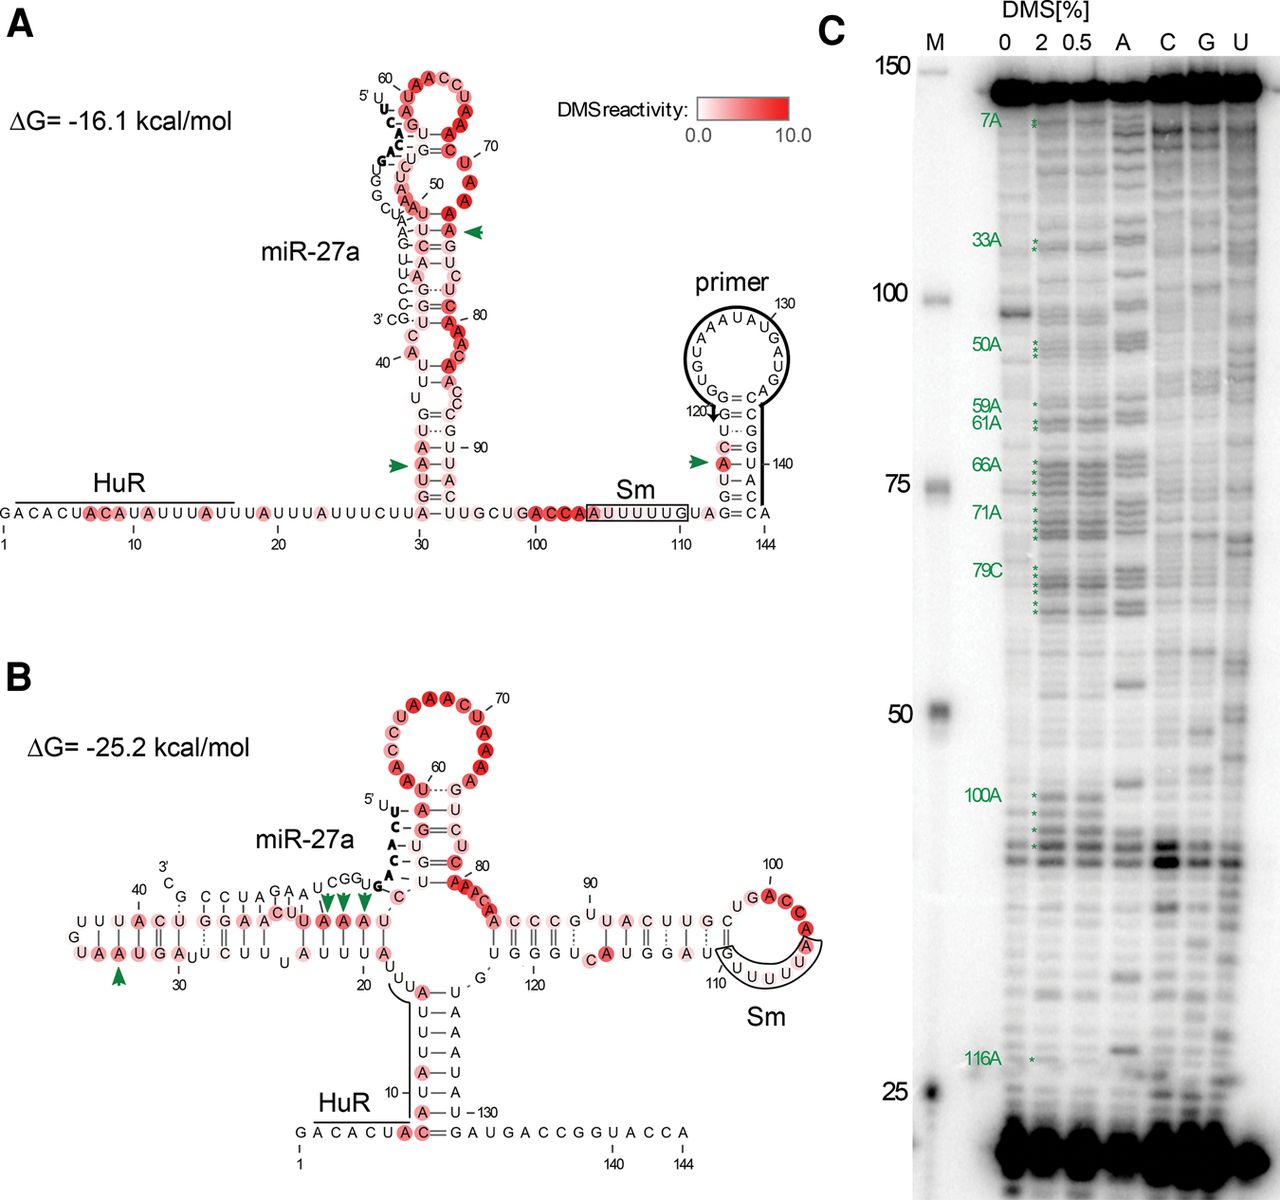
DMS mapping of in vitro transcribed HSUR1. (A) The previous model of HSUR1. (B) The unconstrained minimum free energy (MFE) model. (A,B) Predicted interactions of HSUR1 with miR-27a are depicted. The seed sequence of miR-27a is shown in bold. Watson–Crick base pairs are represented by solid lines and wobble base pairs by dotted lines. Known interaction sites for HuR and Sm proteins are indicated on the structure models. The DMS reactivity from in vitro probing averaged from four independent experiments (example gel shown in C is represented by the intensity of red color at each base. The green arrows indicate nucleotides predicted to be in Watson–Crick pairs flanked by Watson–Crick pairs that have strong DMS reactivity. (C) In vitro DMS probing of HSUR1 structure. Primer extension analysis of HSUR1 performed on in vitro transcribed RNA, treated or not with DMS. M, marker; A, C, G, and U correspond to sequencing lanes containing, respectively, ddTTP, ddGTP, ddCTP, and ddATP. Green stars depict strong DMS reactivity (>4× average) obtained from the average of four independent experiments.




