


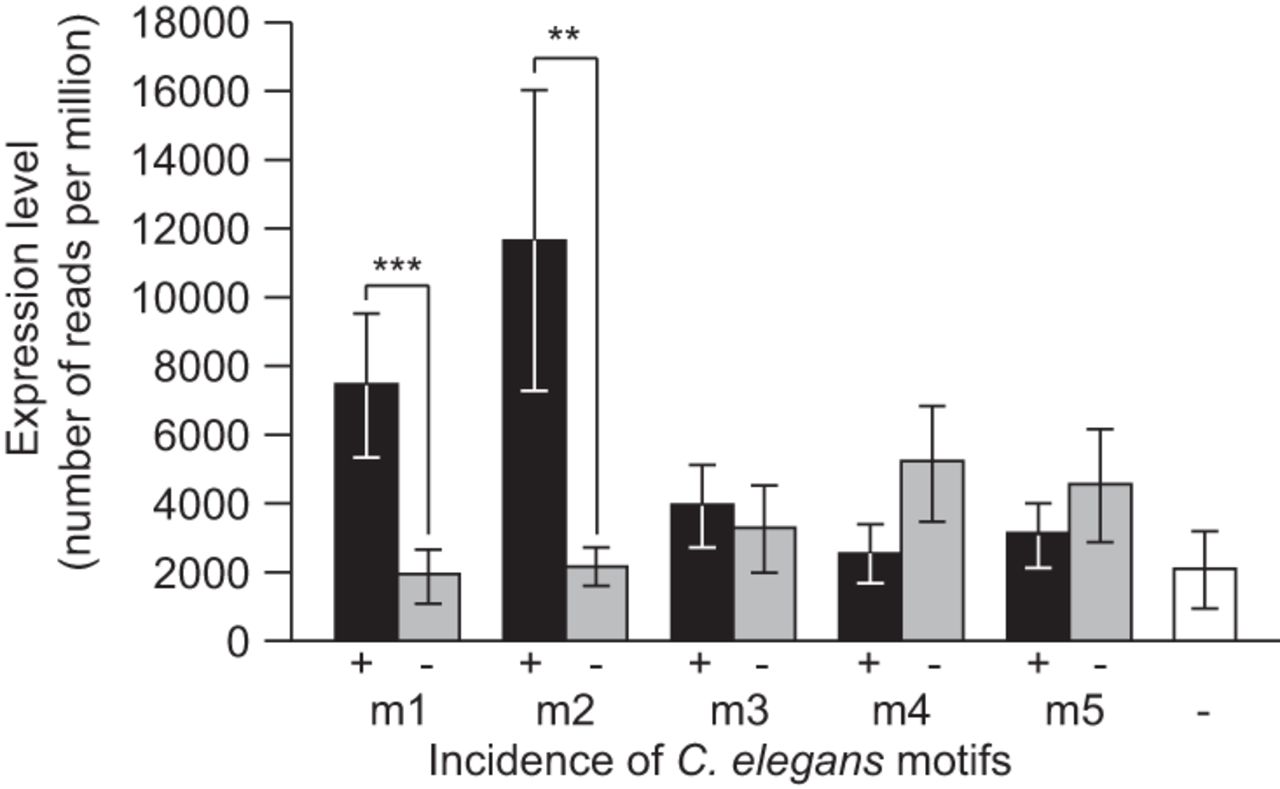
FIGURE 4.
C. elegans miRNAs with motifs m1 or m2 are expressed at higher level than miRNAs lacking these motifs in their upstream sequence. miRNAs are partitioned based on the presence (+) or absence (−) of each motif, and normalized miRNA expression level (number of sequencing reads per million) is compared between each of the two groups. For comparison, mean expression levels of miRNAs lacking all motifs m1–m5 are indicated in white. Means are represented ±1 standard error. Wilcoxon two-sample tests: (**) P < 0.01, (***) P < 0.001.




