


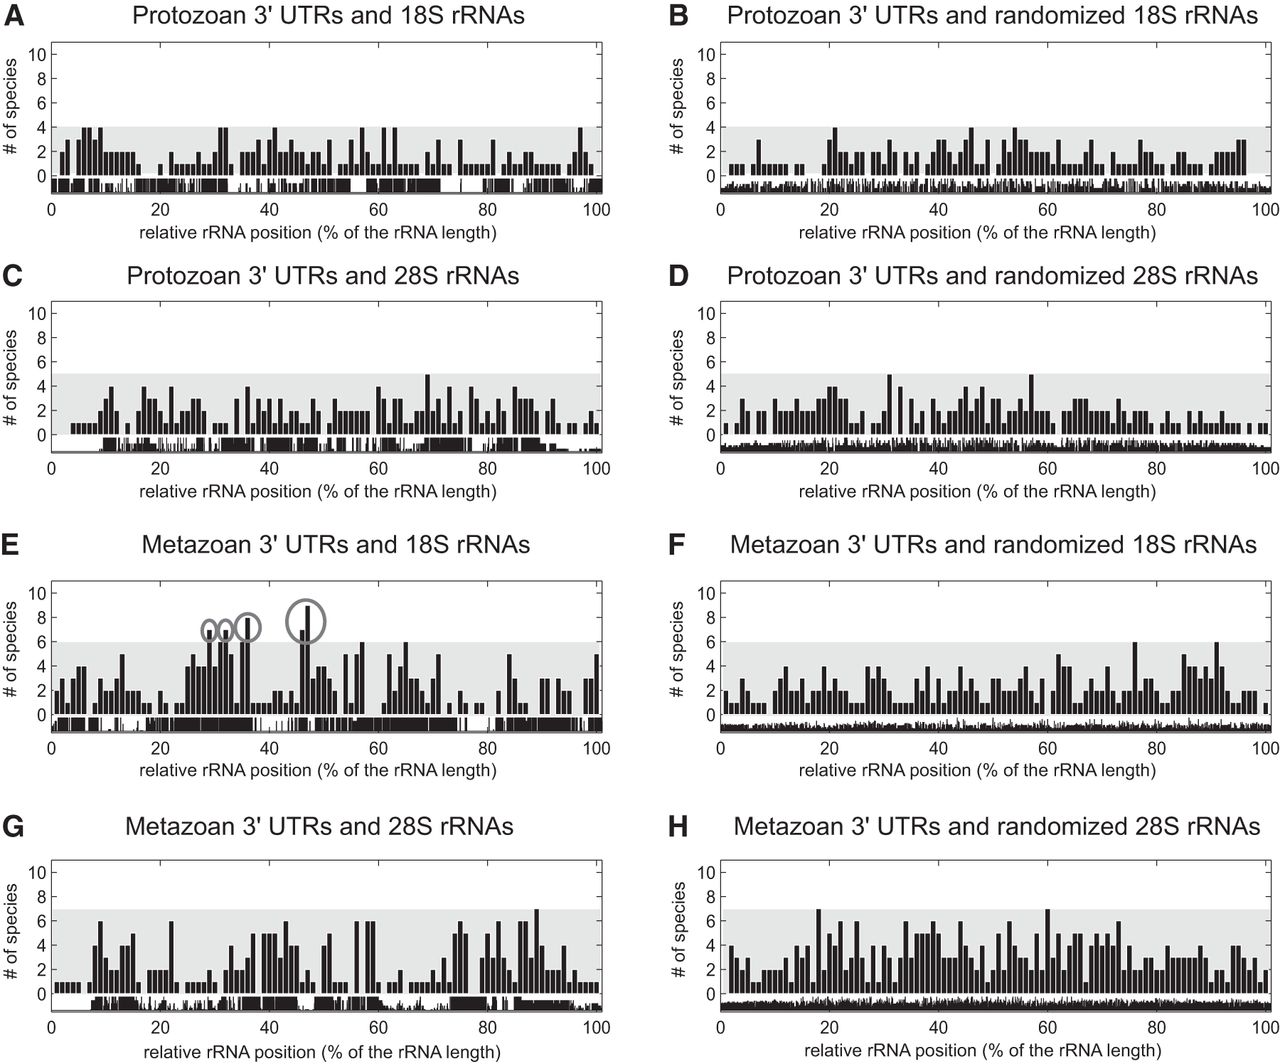
Evolutionary conservation of statistically significant sequence complementarity between rRNAs and the first 50 nt of 3′ UTRs. Five protozoan 18S and 28S rRNAs (A–D), nine metazoan 18S rRNAs (E,F), and eight metazoan 28S rRNAs (G,H) were analyzed for evolutionary conservation. The horizontal axis of each panel shows relative positions in percent of the length of rRNAs. The vertical axis shows the number of species with statistically significant complementarity at a given position within the native (A,C,E,G) and representative randomized (B,D,F,H) rRNA sequences. The randomized rRNA sequences were used for statistical estimation of cut-off lines that separate a nonspecific computational and/or biological noise from evolutionarily conserved complementarity (see Materials and Methods). The cut-off level is shown as the gray zone in each panel. Only bars above the gray zone indicate evolutionarily conserved complementarity to 3′ UTRs, indicated in the figure by light gray ellipses. Black profiles at the bottom of each panel indicate evolutionary conservation of rRNA sequences.




