


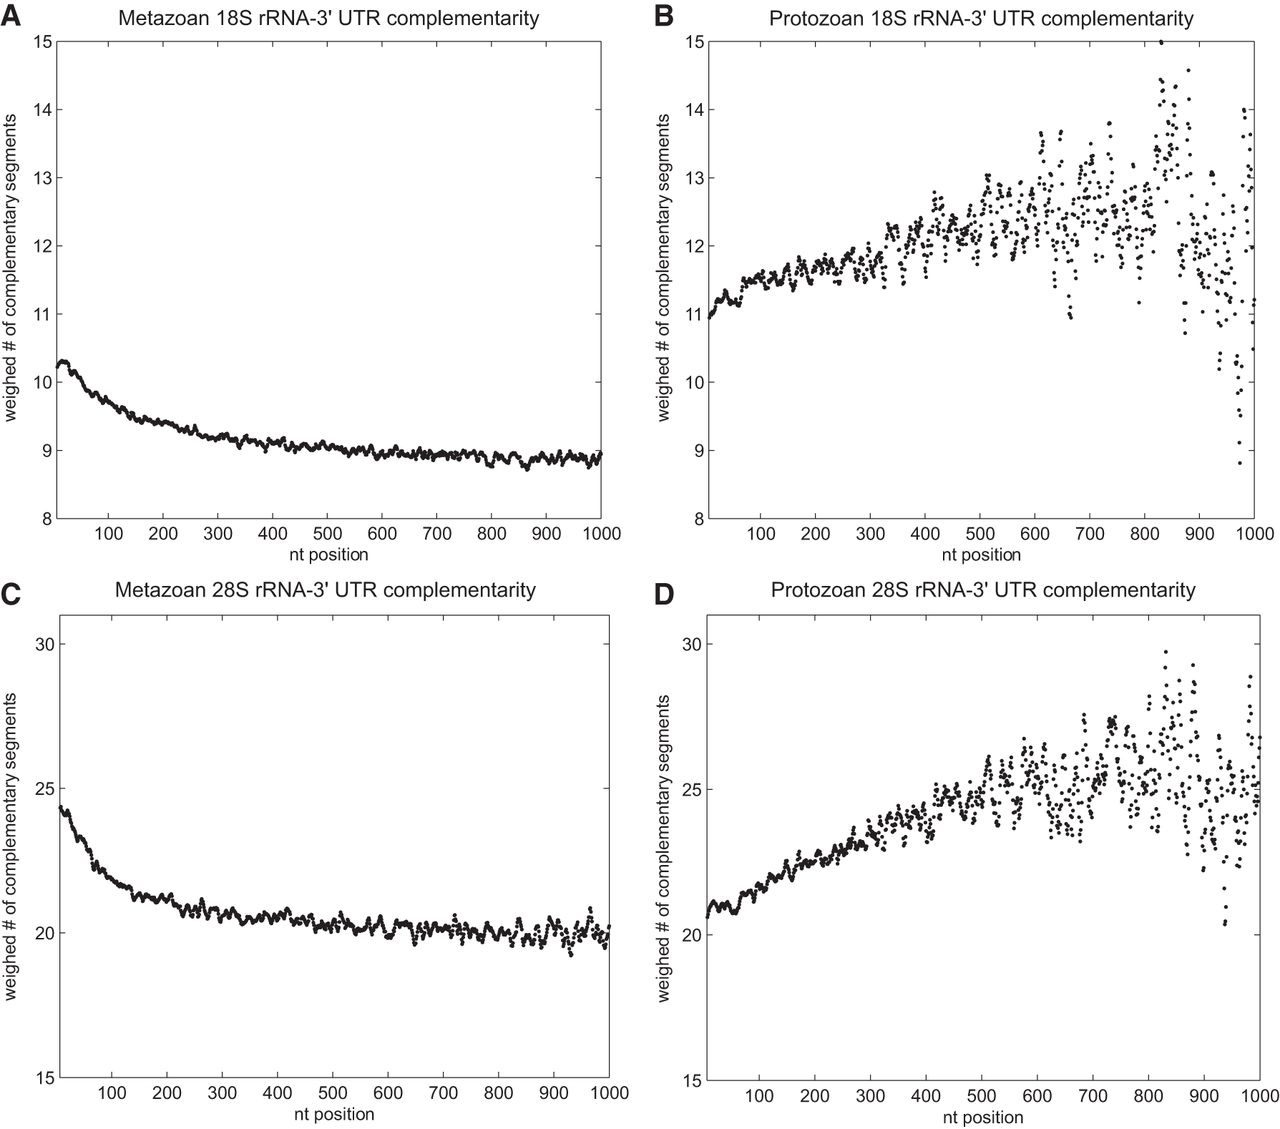
Sequence complementarity between the mRNA 3′ UTRs and 18S and 28S rRNAs within the metazoan (A,C) and protozoan (B,D) 3′ UTRs. The sequence complementarity is shown as counts of complementary sequences (y-axis) at each nucleotide position (x-axis) in all 3′ UTRs of all analyzed species. The counts were normalized to numbers of 3′ UTR sequences that were long enough to include a given nucleotide position. The greater the nucleotide position in each diagram, the lesser the number of nucleotides available at that position for computation, because the number of 3′ UTRs with the equal or bigger length relative to that position decreases. The minimal length of all analyzed 3′ UTR sequences was 50 nt, and as such all tested 3′ UTRs have their first 50 nt included in all calculations of sequence complementarity for the first 50 positions. In the case of the protozoan 3′ UTRs, the noise caused by the small number of available sequences took effect for positions >300 (showed by increasingly dispersed character of the curve at positions >300 [B,D]) as they were generally a lot shorter than those of metazoans. Please note that the reason for approximately two times higher maximum of complementarity in 28S rRNA versus 18S rRNA is the length of the 28S rRNA, which is in metazoans ∼2–2.5 longer than 18S rRNA. The counts of complementary segments were not normalized to the length of individual rRNAs since the purpose of this analysis was not a comparison between the two types of rRNA.




