


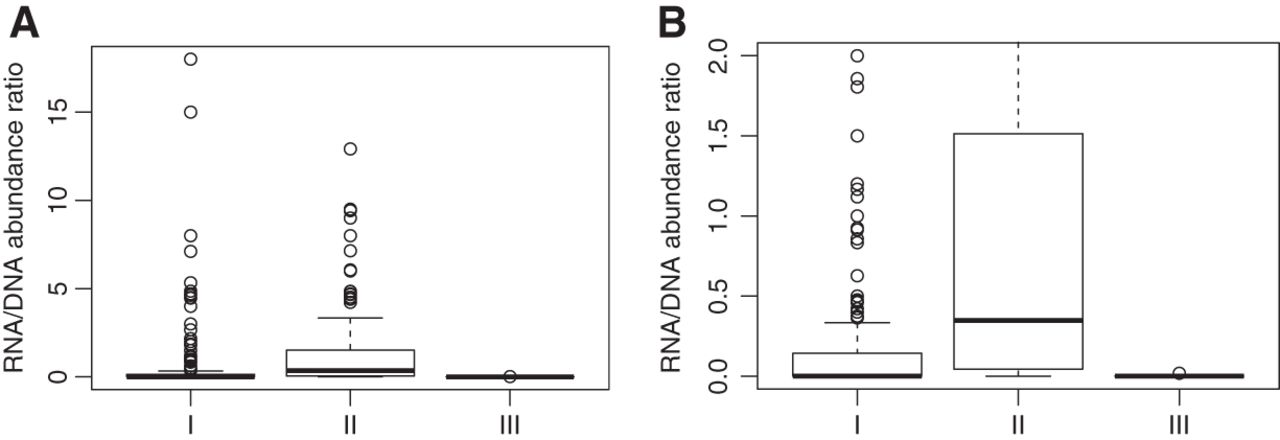
FIGURE 7.
Comparison of expression levels for the CRISPR arrays associated with different types of CRISPR–Cas systems (I, II, and III). In the boxplots, the y-axis represents the RNA/DNA abundance ratio (measured as the ratios of the number of RNA-seq reads divided by the number of metagenomic reads that can be mapped to the same array) for the arrays. (B) The zoomed-in view of A with the maximum ratio set to 2.




