


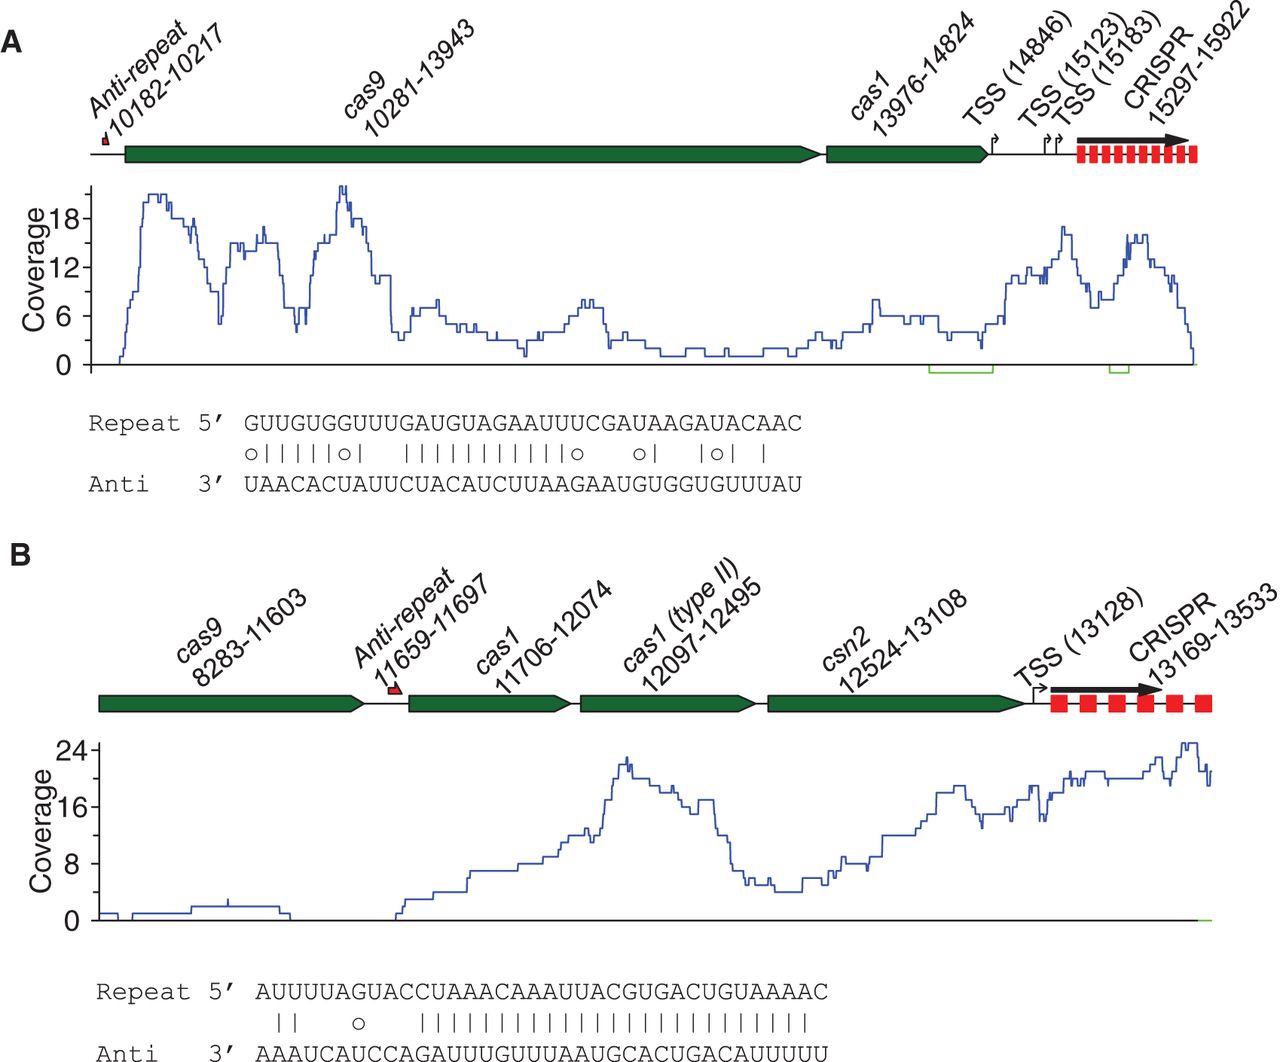
Expression profiles for selective CRISPR–Cas systems. (A) A contig (of 15,939 bp; id: 1828570), which contains a putative type II CRISPR–Cas system sharing identical CRISPR repeats with A. shahii. Only part of the contig is shown for clarity. (B) A contig (of 20,551 bp; id: 1941627), which contains a type II CRISPR–Cas system associated with E. rectale. For each contig, putative elements of the CRISPR–Cas systems—including cas genes, the CRISPR, putative TSS(s) in the leader sequence, and an anti-repeat region—are shown in the plot with numbers indicating their genomic locations, and a black arrow above the CRISPR indicating the transcription orientation supported by metatranscriptomic reads. The read coverage curves are shown below the contig, with the coverage for forward and reverse strands shown in blue and green, respectively. Below the coverage plot shows the base-pairing between predicted anti-repeat region (Anti) and the CRISPR repeat (Repeat), with small circles indicating wobble base pairs (G–U).




