


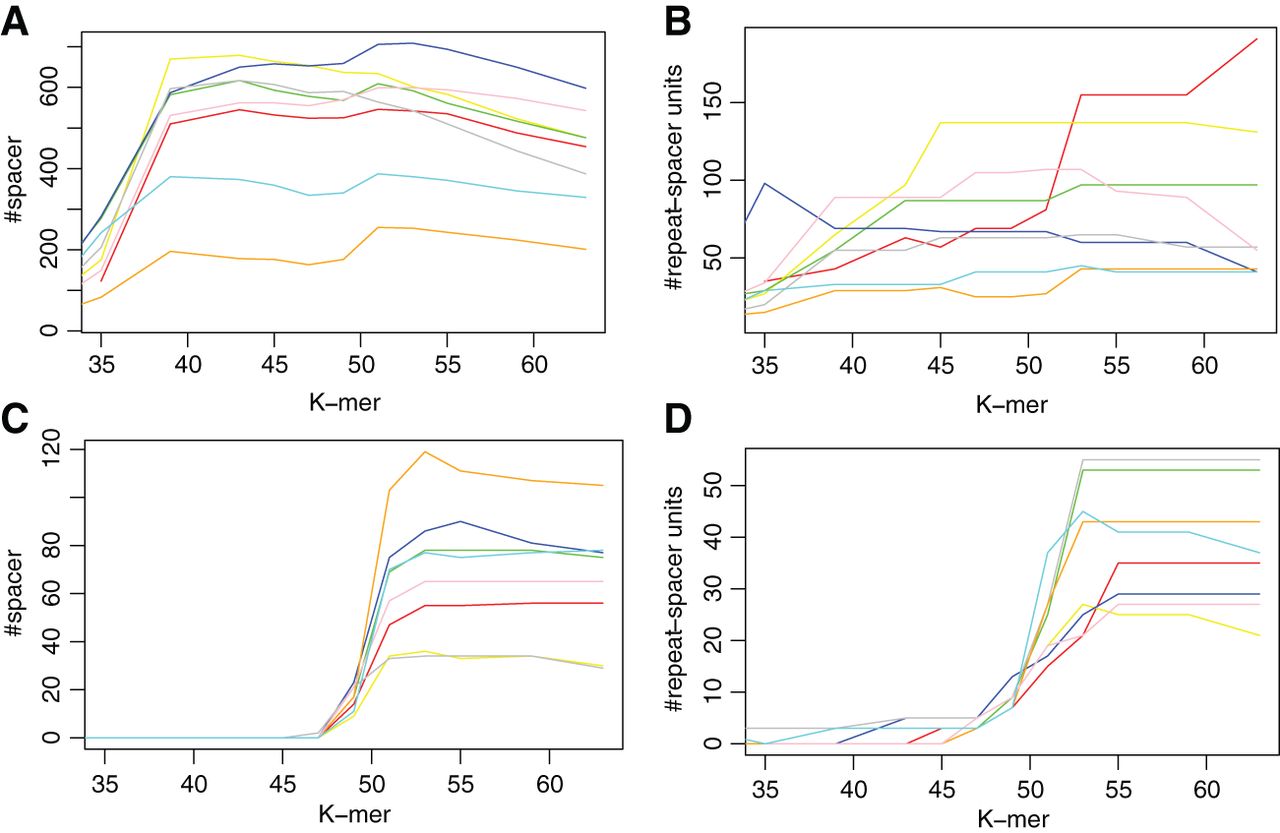
FIGURE 1.
The impact of k-mer size on the assembly of CRISPRs. A and C show the total number of spacers identified when different k-mer sizes were used, and B and D show the longest CRISPR arrays (number of repeat-spacer units). A and B are based on the CRISPR arrays associated with 33 CRISPR repeats identified from reference genomes that were found to be highly expressed in the gut microbiome (Franzosa et al. 2014), while C and D show the results for the CRISPR arrays associated with B. fragilis (which has the longest repeat of 47 bp) only. The results for different data sets (from eight individuals) are shown in different colors.




