


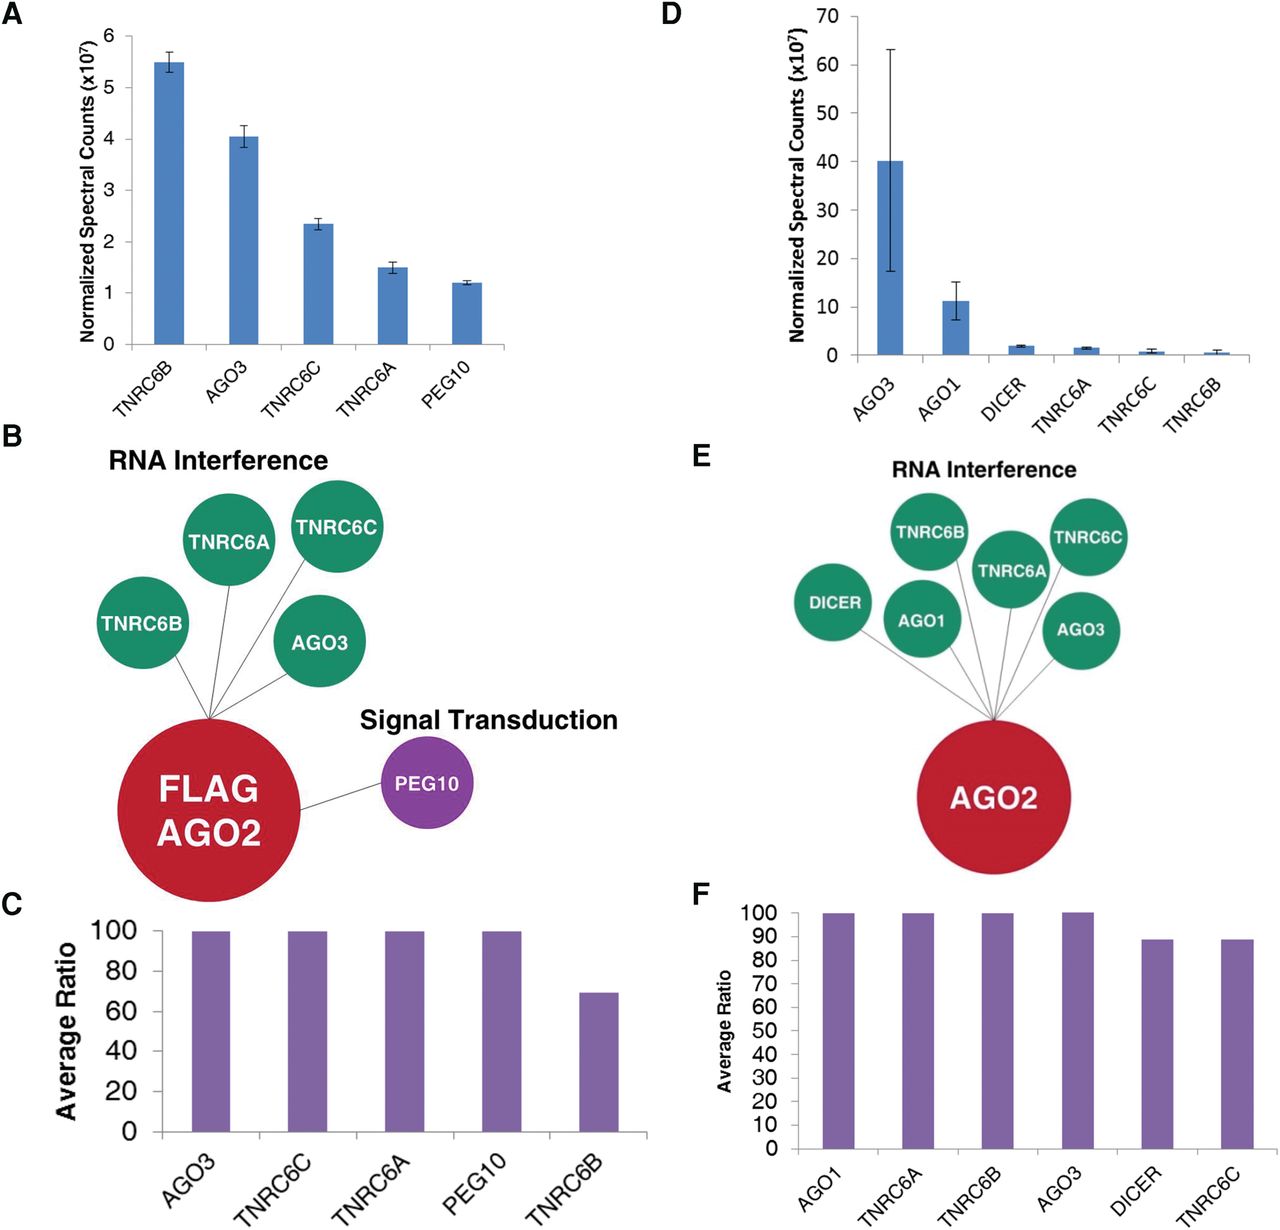
Identification of candidates from nuclear immunoprecipitations (IPs) that had been treated with RNase. (A) Normalized spectral counts of candidates identified from Flag-AGO2 IPs in the nucleus. n = 2. (B) Bubble plot of candidates identified from Flag-AGO2 IPs in the nucleus. Candidates are organized by function. (C) Average ratios of the normalized spectral counts between sample and control for candidates identified from Flag-AGO2 IPs in the nucleus. When no ratio was given (candidate was identified in sample only), a ratio of 100 was assigned. A maximum cutoff of 100 was assigned to the graph. Ratios greater than 100 are represented at the cutoff. (D) Normalized spectral counts of candidates identified from endogenous AGO2 IPs in the nucleus. n = 3. (E) Bubble plot of candidates identified from endogenous AGO2 IPs in the nucleus. Candidates are organized by function. (F) Average ratios of the normalized spectral counts between sample and control for candidates identified from endogenous AGO2 IPs in the nucleus. When no ratio was given (candidate was identified in sample only), a ratio of 100 was assigned. Ratios greater than 100 are represented at the cutoff.




