


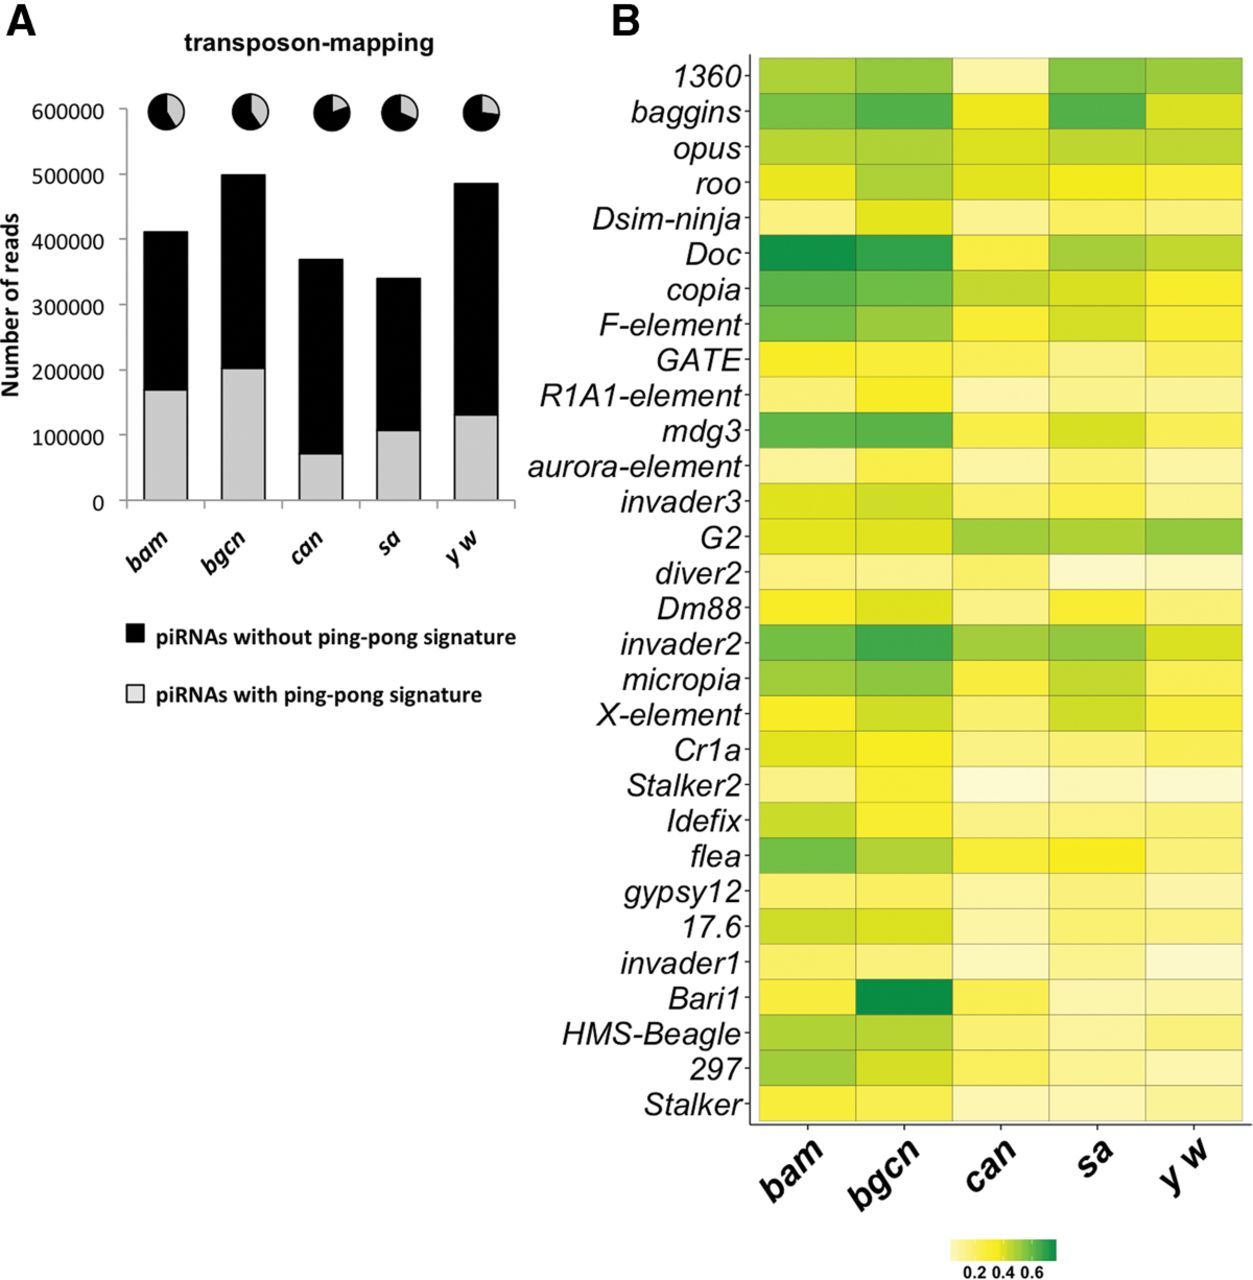
piRNAs with ping-pong signature are more abundant in spermatogonia but still detected in primary spermatocytes. (A) Bar graph showing the normalized numbers of transposon-mapping piRNAs in the indicated libraries. Black and gray bars represent those without a ping-pong signature and with a ping-pong signature, respectively. The pie charts represent the percentage of those piRNAs in the total population of transposon-mapping piRNAs. piRNAs with ping-pong signature were more abundant in bam and bgcn libraries but still detected in can and sa libraries. (B) Heat-map representing the ping-pong ratios of the transposon-mapping piRNAs (minimum in white, maximum in green) in the indicated libraries. For most transposon-mapping piRNA families, the ping-pong ratios are higher in spermatogonia (bam and bgcn libraries) compared with primary spermatocytes (can and sa libraries).




