


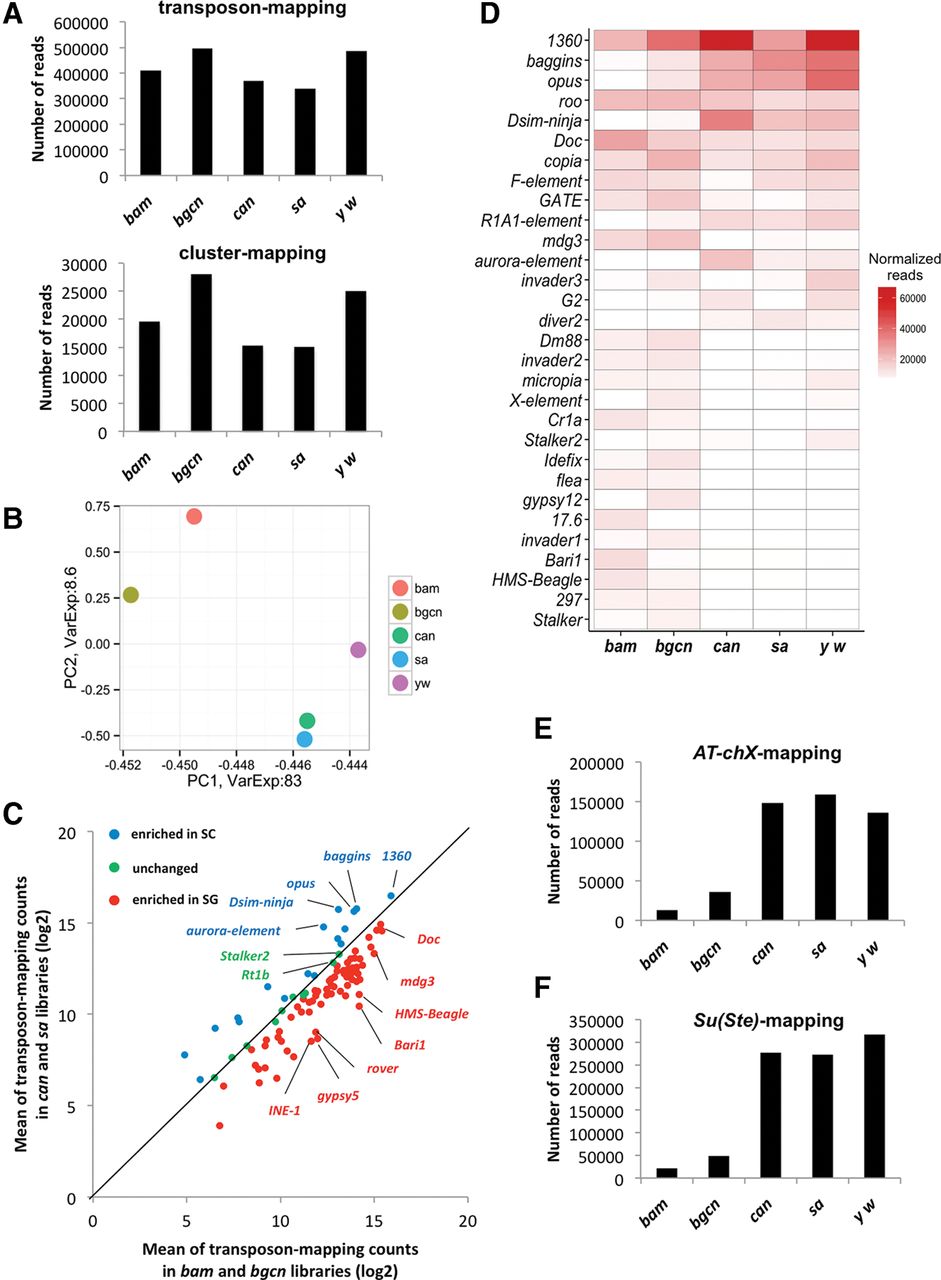
Distinct piRNA populations are produced during spermatogenesis. (A) The normalized numbers of 23- to 29-nt reads mapping to canonical transposons and clusters in bam, bgcn, can, sa, and y w libraries. Transposon and cluster-mapping piRNAs were globally more abundant in bam and bgcn testes. (B) Principal component analysis of transposon-mapping piRNAs in each different type of arrested mutant testes. While piRNAs in can and sa mutants, and those in bam and bgcn exhibit similarity, respectively, they are quite different compared with the other group. (C) Scatter-plot representing the expression of transposon-mapping piRNAs in spermatogonia versus primary spermatocytes. Log2 of the mean number of reads of piRNAs mapping to each transposon families in bam and bgcn mutant testes are plotted on the x-axis, and those in can and sa mutant testes are plotted on the y-axis. piRNAs mapping to most of the transposon families are more abundant in spermatogonia (red dots) while some others are more abundant in primary spermatocytes (blue dots). (D) Heat-map representing the normalized expression levels of the most abundant transposon-mapping piRNAs (minimum in white, maximum in red) in bam, bgcn, can, sa, and y w libraries. Most of the transposon-mapping piRNAs were enriched in bam and bgcn libraries while some others show different trends. (E) The normalized number of AT-chX piRNAs in the indicated libraries. (F) The normalized number of Su(Ste) piRNAs in the indicated libraries. Both Su(Ste) and AT-chX piRNAs were highly enriched in can and sa libraries.




