


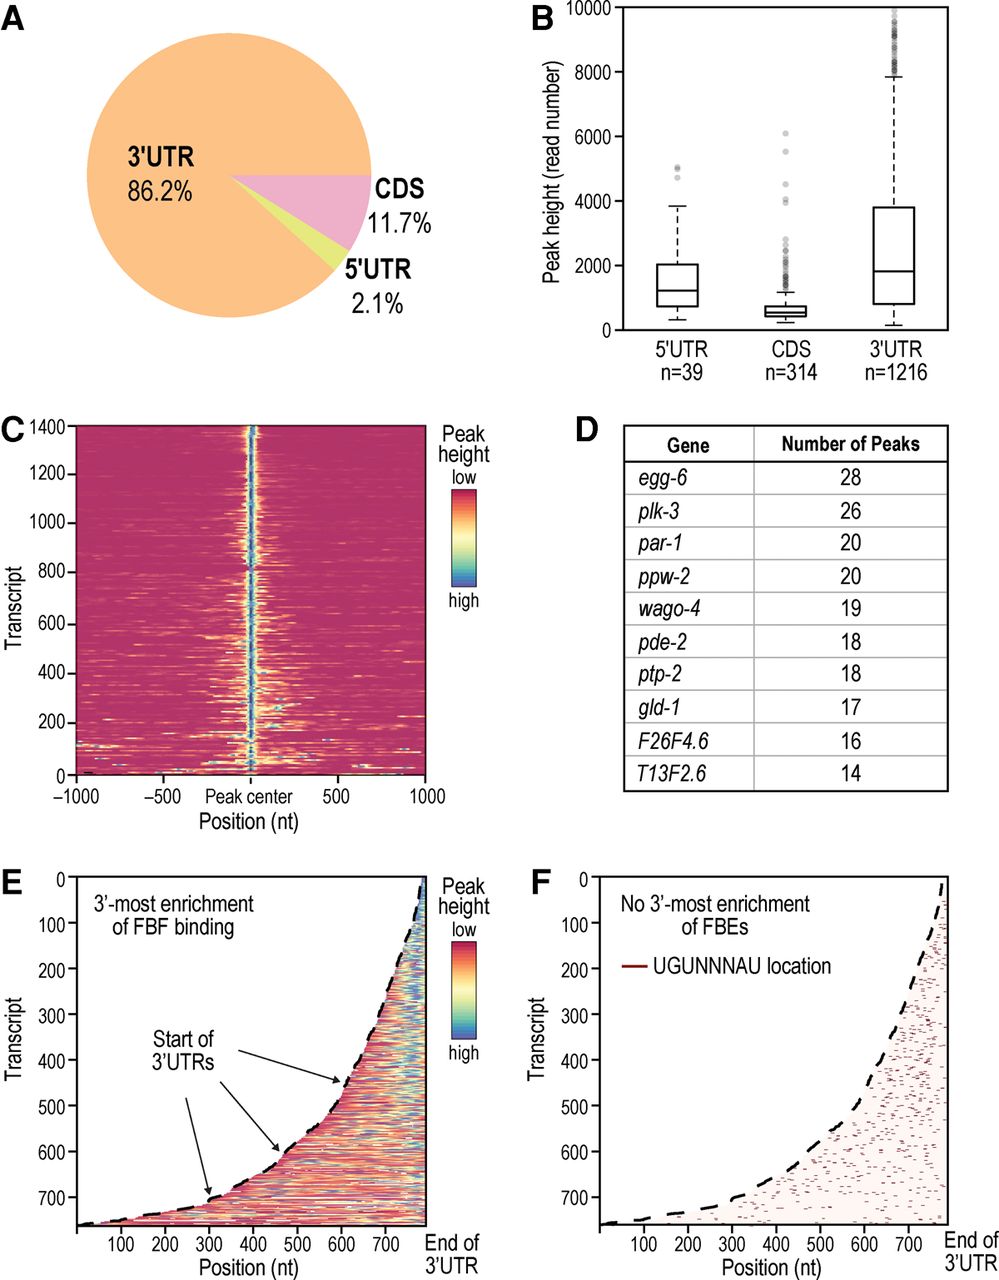
Binding locations of FBF. (A) FBF primarily binds in 3′UTRs, but other binding locations are utilized. Only the tallest peak in a gene was included in this pie chart. (B) 3′UTRs also have the highest average peak height among binding locations. All 1569 peaks in mRNA are included. (C) Heatmap of peak signal within target transcripts spanning 1000 bp on either side of the primary (highest) peak. A fraction of targets (especially visible toward the bottom of the heatmap) has multiple peaks at a variable distance to the primary peak. (D) Top 10 targets with the most detected peaks. (E,F) Heatmaps of peak signal in 3′UTRs (E) and canonical FBE distribution (F). For all peaks, FBF binding is biased toward the 3′-most end while FBEs are more scattered.




