


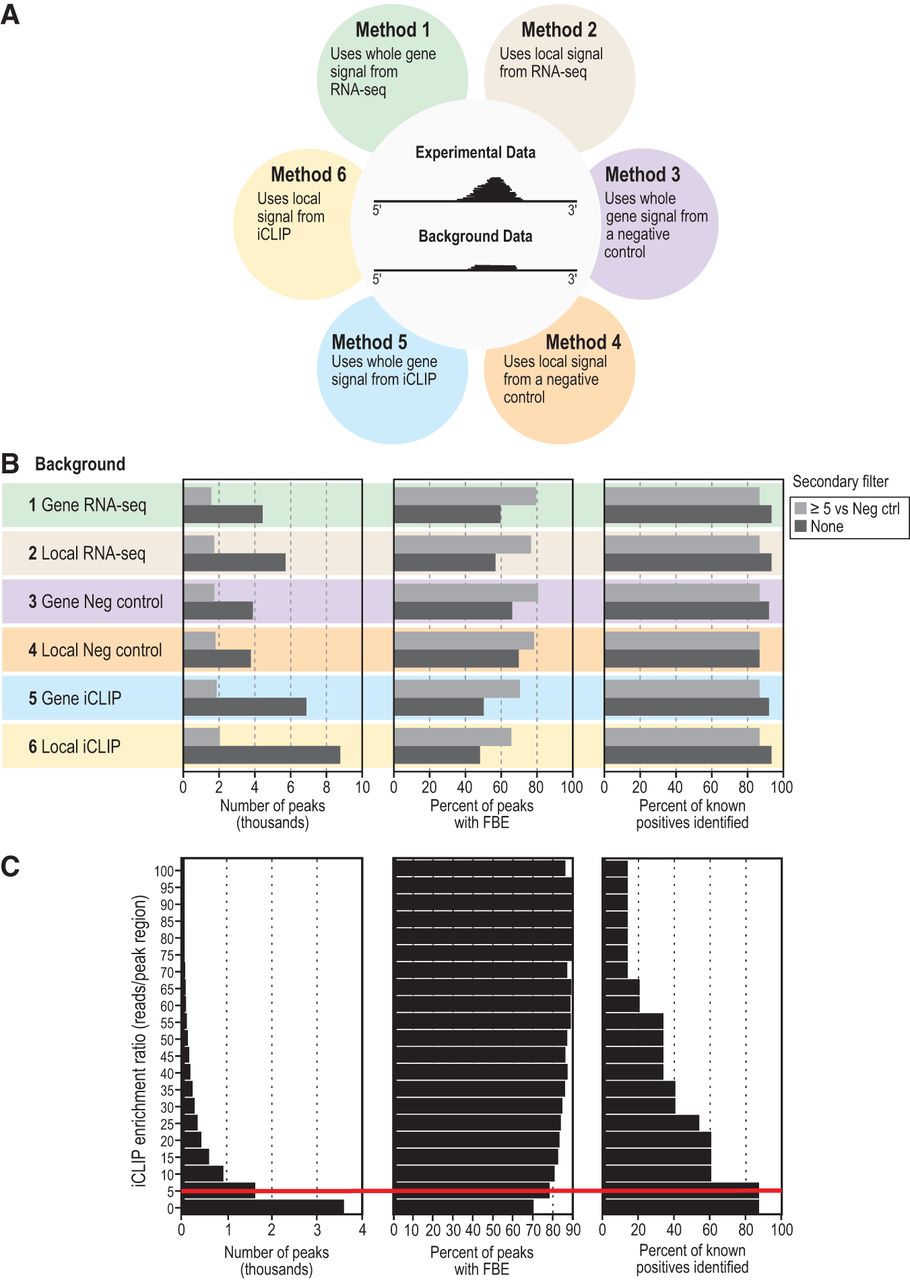
Comparative analysis of six peak calling methods. (A) Six methods for peak calling in iCLIP data. Methods were generated using one of three backgrounds, each within one of two genomic regions. The two genomic regions tested were (i) all exons of the target transcript (termed “whole gene signal”) and (ii) the 500-bp genomic region around the putative peak (termed “local signal”). The three types of background coverage were RNA-seq (Methods 1 and 2), parallel iCLIP from a negative control strain (Methods 3 and 4), or the FBF iCLIP data itself (Methods 5 and 6). (B) Effects of the six methods of peak calling on number of peaks (left), presence of a canonical FBF binding element (FBE) in the peak (middle), and the fraction of 15 known FBF target mRNAs correctly identified as targets (right). Method numbers and coloring are the same as in Figure 2A. The effect of a secondary filter was also tested, shown as light gray bars. The secondary filter required a minimum enrichment ratio of fivefold more experimental iCLIP reads to negative control iCLIP reads within local (500 bp) peak region. (C) Effect of changing the minimum iCLIP enrichment ratio for the secondary filter on the identification of targets. The iCLIP enrichment ratio refers to the ratio of experimental iCLIP reads to negative control iCLIP reads within local (500 bp) peak region. (Left) Range of iCLIP enrichment ratios queried. (Middle) Percentage of peaks harboring an FBE at each enrichment ratio shown on left. Because FBEs are scored in sequences defined by merging peak regions within and between replicates, increasing the filtering ratio can decrease the width of the consensus peak, resulting in the loss of an FBE. (Right) Percentage of 15 validated FBF target mRNAs identified at each enrichment ratio shown on left. A red line highlights the enrichment ratio cutoff of 5, at which the percentage of peaks harboring an FBE is greatly increased without lowering the number of identified positive control target mRNAs.




