


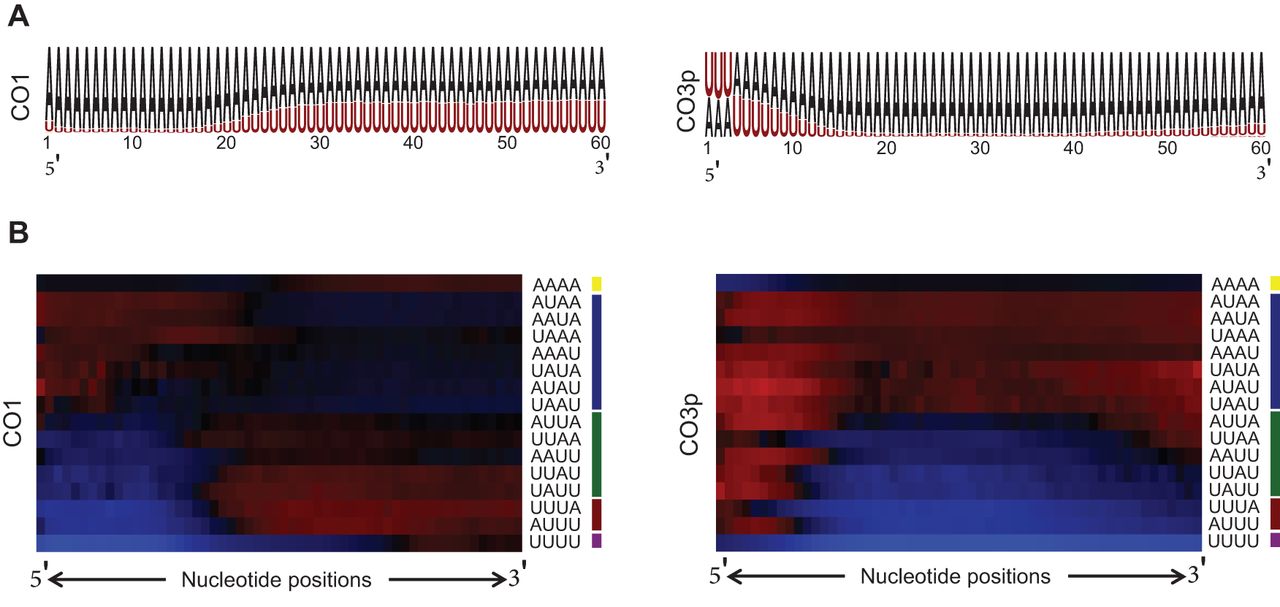
(A) Relative abundance of each nucleotide at each position from tail positions 1–60. All tails possessing a nucleotide at the analyzed position in the total population were considered. (B) Heat map describing the occurrence of the indicated tetramer (nucleotide position 1 of the tetramer at the position indicated at the bottom), relative to the likelihood of that tetramer given the average nucleotide compositions at those positions under an independently distributed model. “Nucleotide positions” are tail positions 1–60 from 5′ to 3′ as in A. Both plots are colored on the same scale; the lowest (most intense red) value was 0.0217 (occurring 1/46th as often as expected under an independently distributed model), and the highest (most intense blue) value was 3356 (occurring 3356 times as often as expected under an independently distributed model). At each position, the entire population of tails possessing a full tetramer starting at that position is analyzed.




