


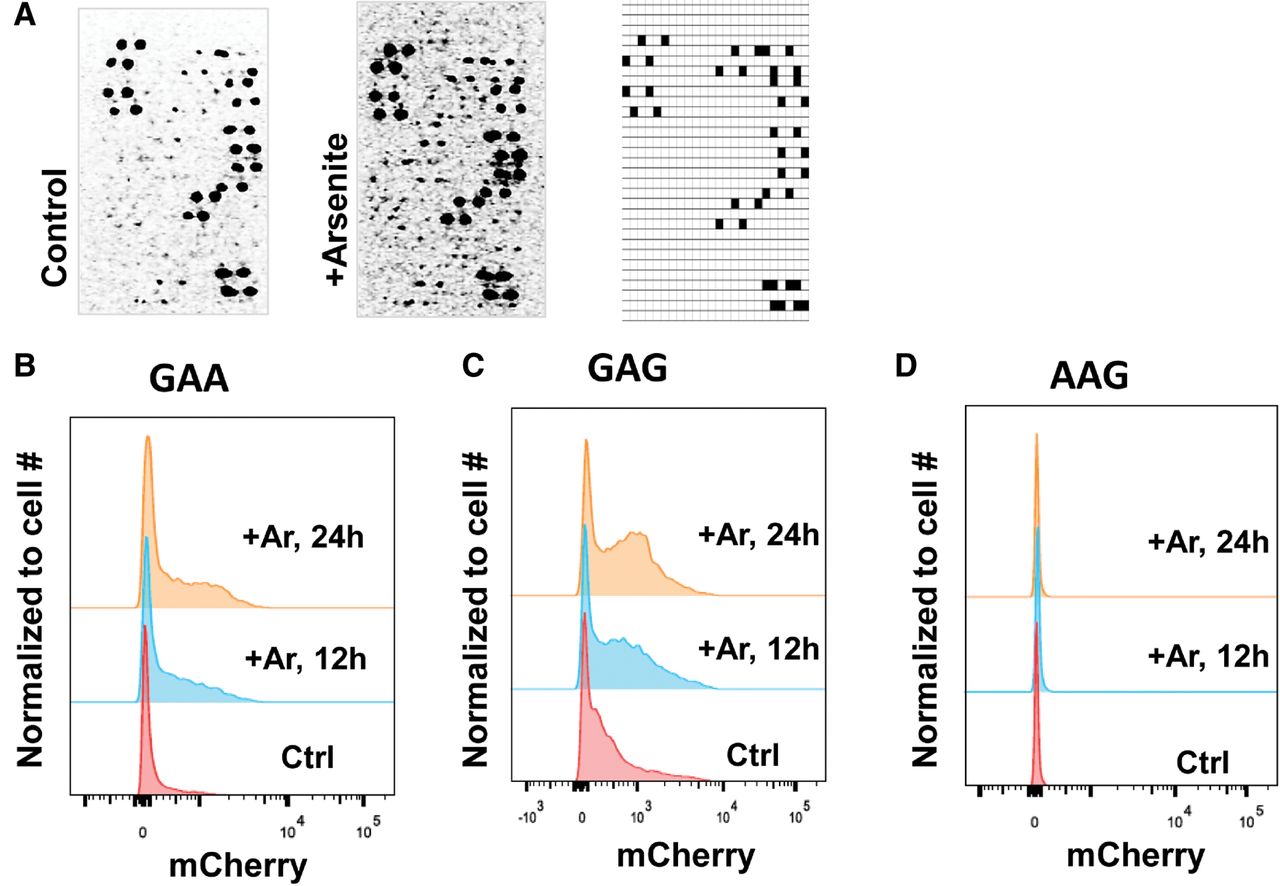
FIGURE 3.
Oxidative stress increases mistranslation of GAA (Glu) and GAG (Glu) mCherry stable lines. (A) tRNA microarrays showing increase of misacylation upon arsenite treatment. Array grid shows the spots for cognate Met-tRNAs. (B) Histogram shows the distribution of mCherry fluorescence intensity for GAA (Glu) cells. (C) Histogram shows the distribution of mCherry fluorescence intensity for GAA (Glu) cells. (D) Histogram shows the distribution of mCherry fluorescence intensity for AAG (Lys) cells. In all cases, the histograms represent the average of at least three experimental replicates from two separate experiments.




