


FIGURE 3.
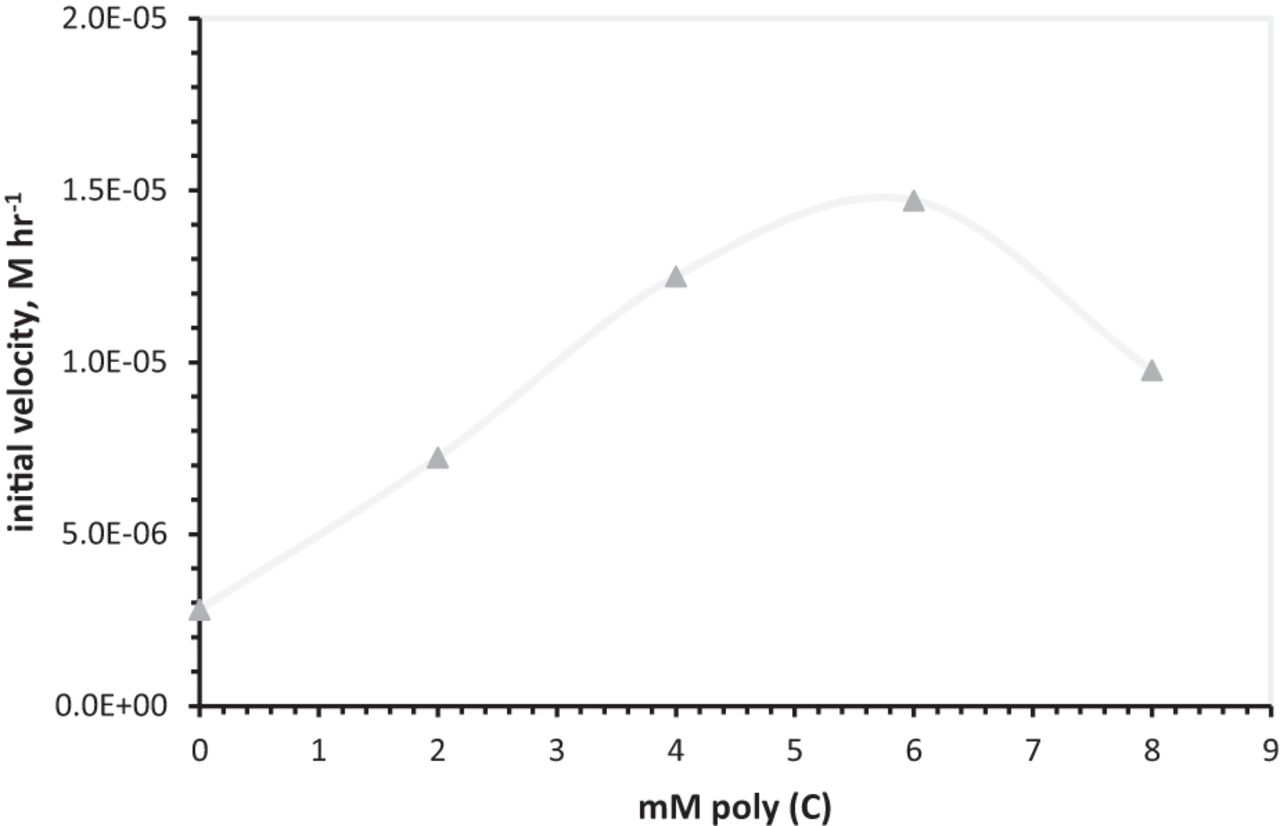
Response of GppG synthesis to poly(C) concentration; triangles are initial velocities from least squares linear fitting to early GppG concentrations versus time.
(Downloading may take up to 30 seconds. If the slide opens in your browser, select File -> Save As to save it.)
Click on image to view larger version.
Response of GppG synthesis to poly(C) concentration; triangles are initial velocities from least squares linear fitting to early GppG concentrations versus time.
 CiteULike
 Delicious
 Digg
Digg Facebook
 Reddit
 Twitter
Molecular Cloning
The New Edition
Buy Now and Save 30%
Paperback only
(limited time offer)

|
Molecular Cloning: A Laboratory Manual (Fourth Edition) |
