


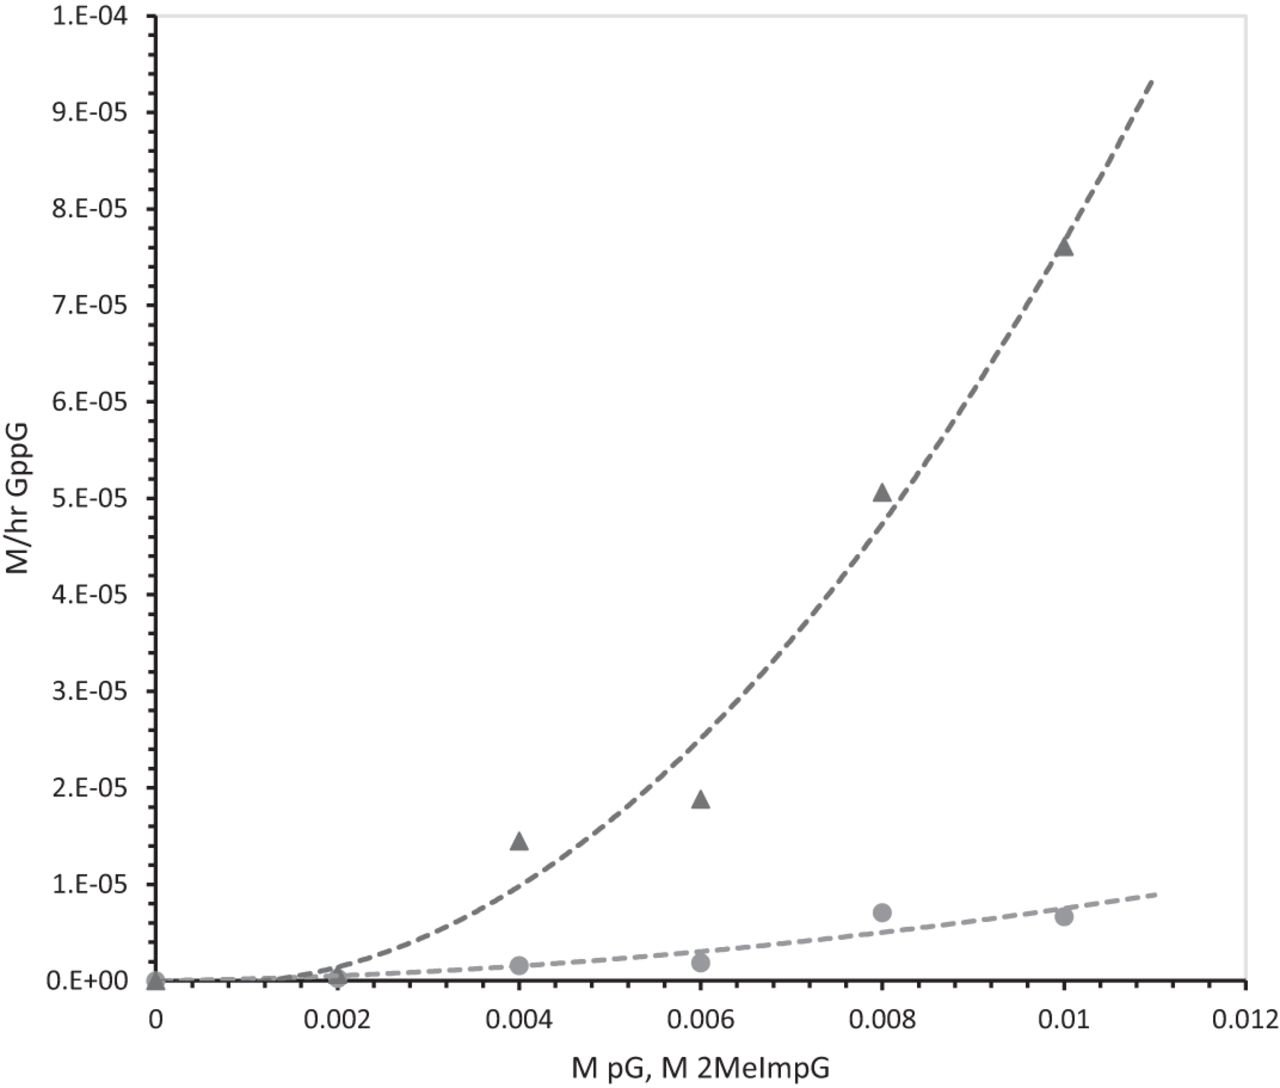
FIGURE 2.
Initial rate of GppG synthesis with variation in nucleotide substrate concentration. Triangles, with poly(C); circles, without polymer. Rates are those from least squares slopes from lines fitted to GppG measured six times in the initial 8 h at 12°C.




