


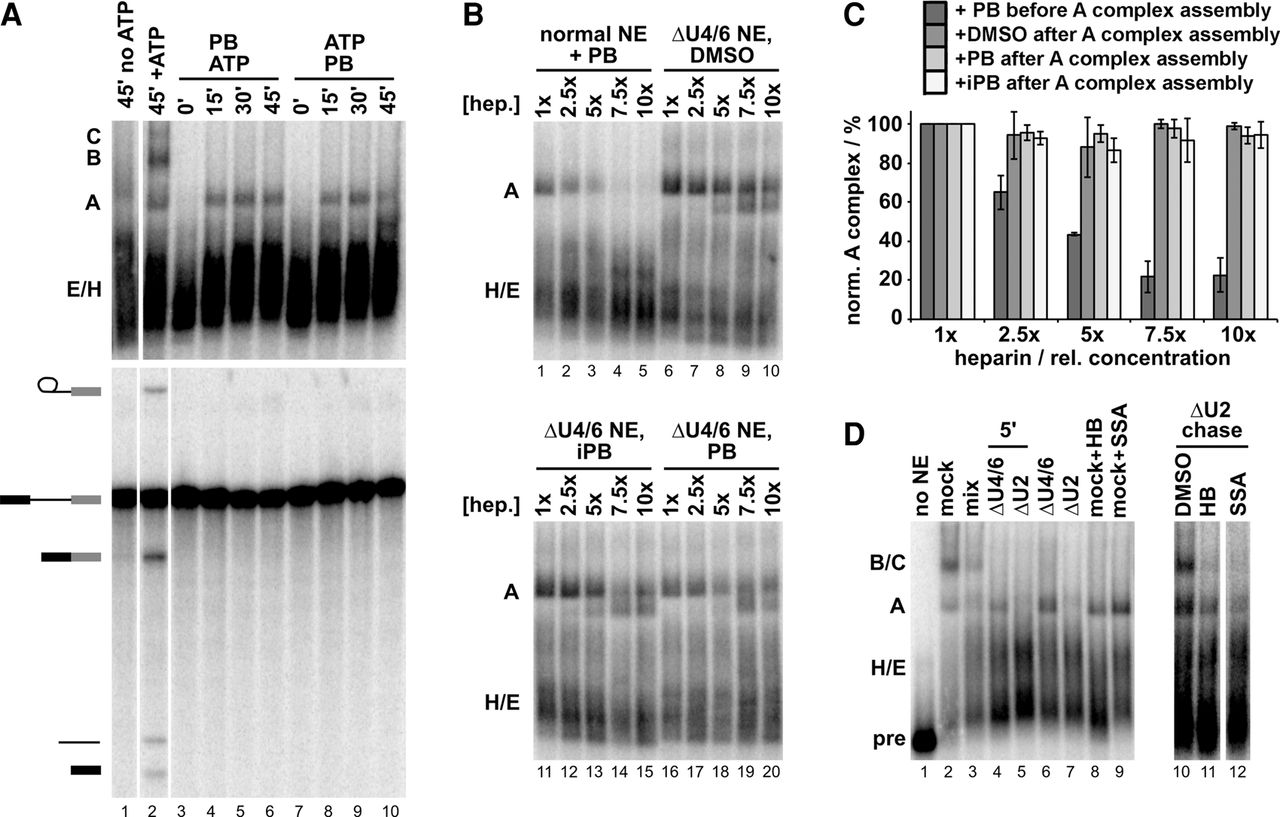
SF3B1 inhibitors interfere with spliceosome assembly after stable A complex formation. (A) (Top panel) Native gel analysis of spliceosome complexes assembled in HeLa NE incubated for indicated time (minutes). No ATP refers to ATP-depleted NE; +ATP indicates ATP-depleted extract with added ATP; in lanes 3–6, NE was pre-incubated with 1 µM PB (2) followed by addition of ATP and pre-mRNA substrate; in lanes 7–10, NE was pre-incubated with ATP followed by addition of 1 µM PB (2) and pre-mRNA substrate. The identities of spliceosome complexes are denoted with assembly occurring in the following order: H/E → A → B → C. (Lower panel) Denaturing gel analysis of the same in vitro splicing reactions shown in the top. Band identities are indicated on the left as in Figure 2. (B) Representative native gel analysis of spliceosome complexes assembled for 30 min at 30°C in the presence of PB (2) (lanes 1–5) or in NE depleted of U4/6 snRNAs (ΔU4/6), after which DMSO, 1 µM PB (2), or iPB (5) was added. The complexes were then challenged with increasing heparin (hep.) concentration in which 1x is 0.5 mg/mL. (C) Native gels as shown in B were quantified to calculate the percent of A complex relative to total splicing complexes with increasing heparin concentration. Values were normalized to the amount of A complex in 0.5 mg/mL (1x) heparin and represent averages of technical replicates of 2–4 independent assays. (D) Lanes 1–9 show native gel analysis of spliceosome complexes assembled for 30 min (unless otherwise indicated) at 30°C in: no NE, mock-depleted NE (mock), U2 or U4/U6 snRNA-depleted NE (ΔU2, ΔU4/U6), a mixture of ΔU2 and ΔU4/U6 (mix). For lanes 10–12, stable A complex was assembled in ΔU4/6 NE for 10 min, after which ΔU2 NE and indicated compounds were added and incubated for an additional 20 min. When included, HB and SSA are at 5 µM.




