


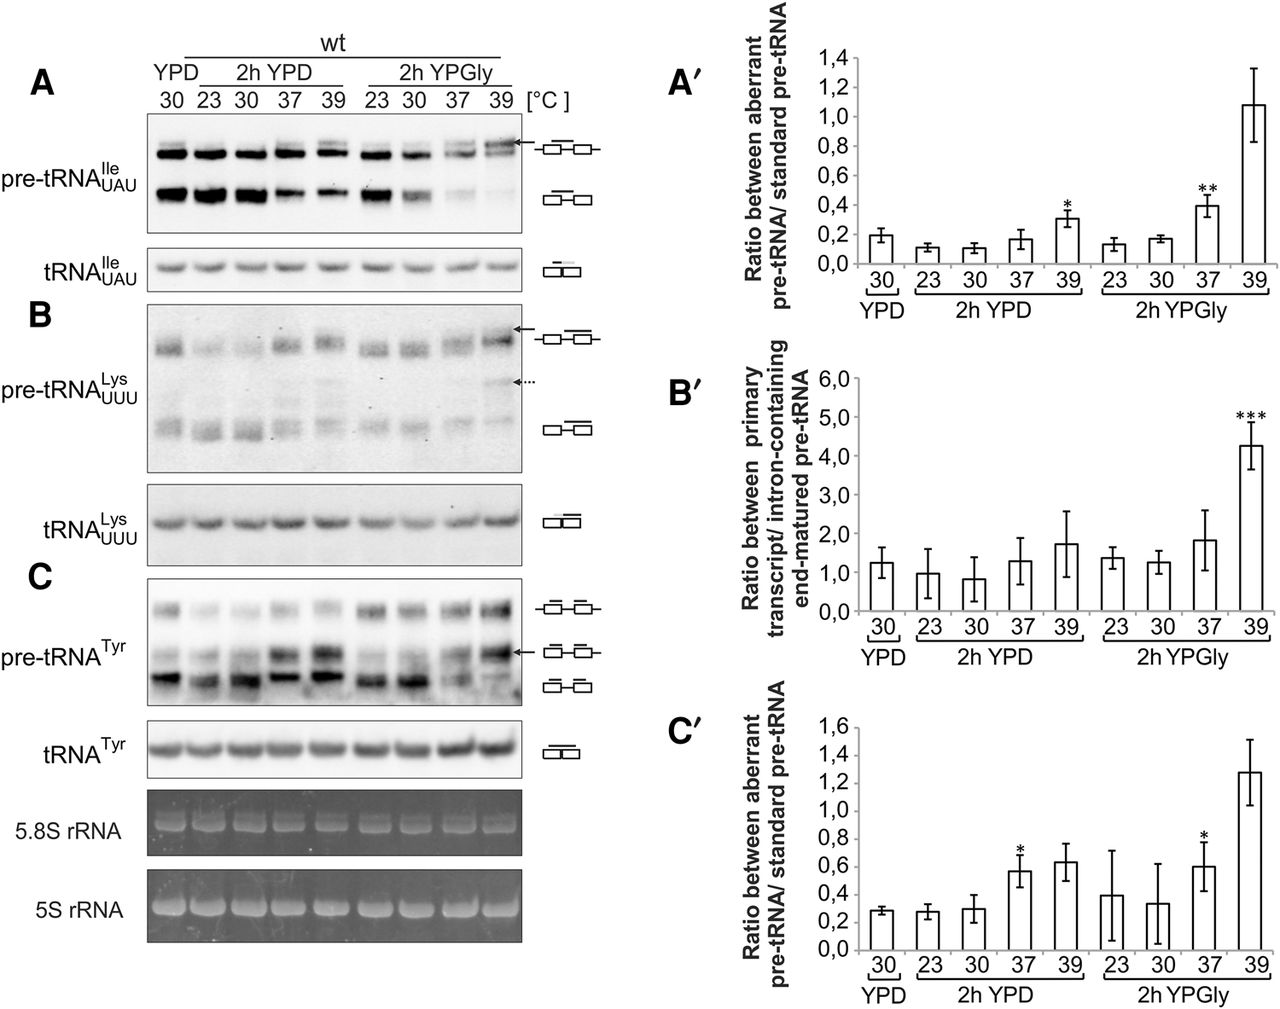
Patterns of tRNA precursors differ depending on growth conditions and tRNA isotype. (A–C) The wild-type yeast strain was grown in media with glucose as the carbon source (YPD) at 30°C to exponential phase and then shifted for 2 h to different temperatures (23°C–39°C) and/or to media containing glycerol as the carbon source (YPGly). RNAs were isolated and analyzed by Northern hybridization with probes specific to indicated tRNAs. Due to the high levels of mature tRNAs with respect to processing intermediates, different exposures were taken from blot hybridized with the same probe to assess pre-tRNAs and mature tRNAs in this and following figures. The major and minor forms of pre-tRNA precursors that accumulate under stress conditions are indicated by solid and dashed arrows, respectively. The following graphic representations for tRNA species were used in this and all subsequent figures: (–□–□–) tRNA precursor containing introns and unprocessed 5′ and 3′ends; (□–□–) tRNA precursor with intron and unprocessed 3′ end; (□–□) end-matured intron-containing pre-tRNA; (□□) mature tRNA. Positions of binding of probes to each form are marked with a black line above tRNA graphic representations. This and all succeeding Northern blots are representative of at least three independent biological replicates of experiments in which ethidium bromide–stained 5.8S and 5S rRNA serve as the loading controls. (A′–C′) Calculation of pre-tRNA ratios from at least three biological replicates. The bars represent the ratios between the levels of the following forms: for tRNAUAUIle the ratios between the slower migrating (aberrant) and faster migrating (standard) forms containing 5′ and 3′ termini and introns; for tRNAUUULys the ratio between end-extended intron-containing forms (primary transcript) and end-matured intron-containing form; and for tRNATyr the ratios of the aberrant 5′ processed 3′ end-containing (aberrant) form with respect to the end-matured intron-containing tRNA (standard). Standard deviation and P-value calculated as a two-tailed t-test are presented on the graphs. Asterisks above the bars designate, respectively, (*) P-value <0.05, (**) P-value <0.005, (***) P-value <0.0005.




