


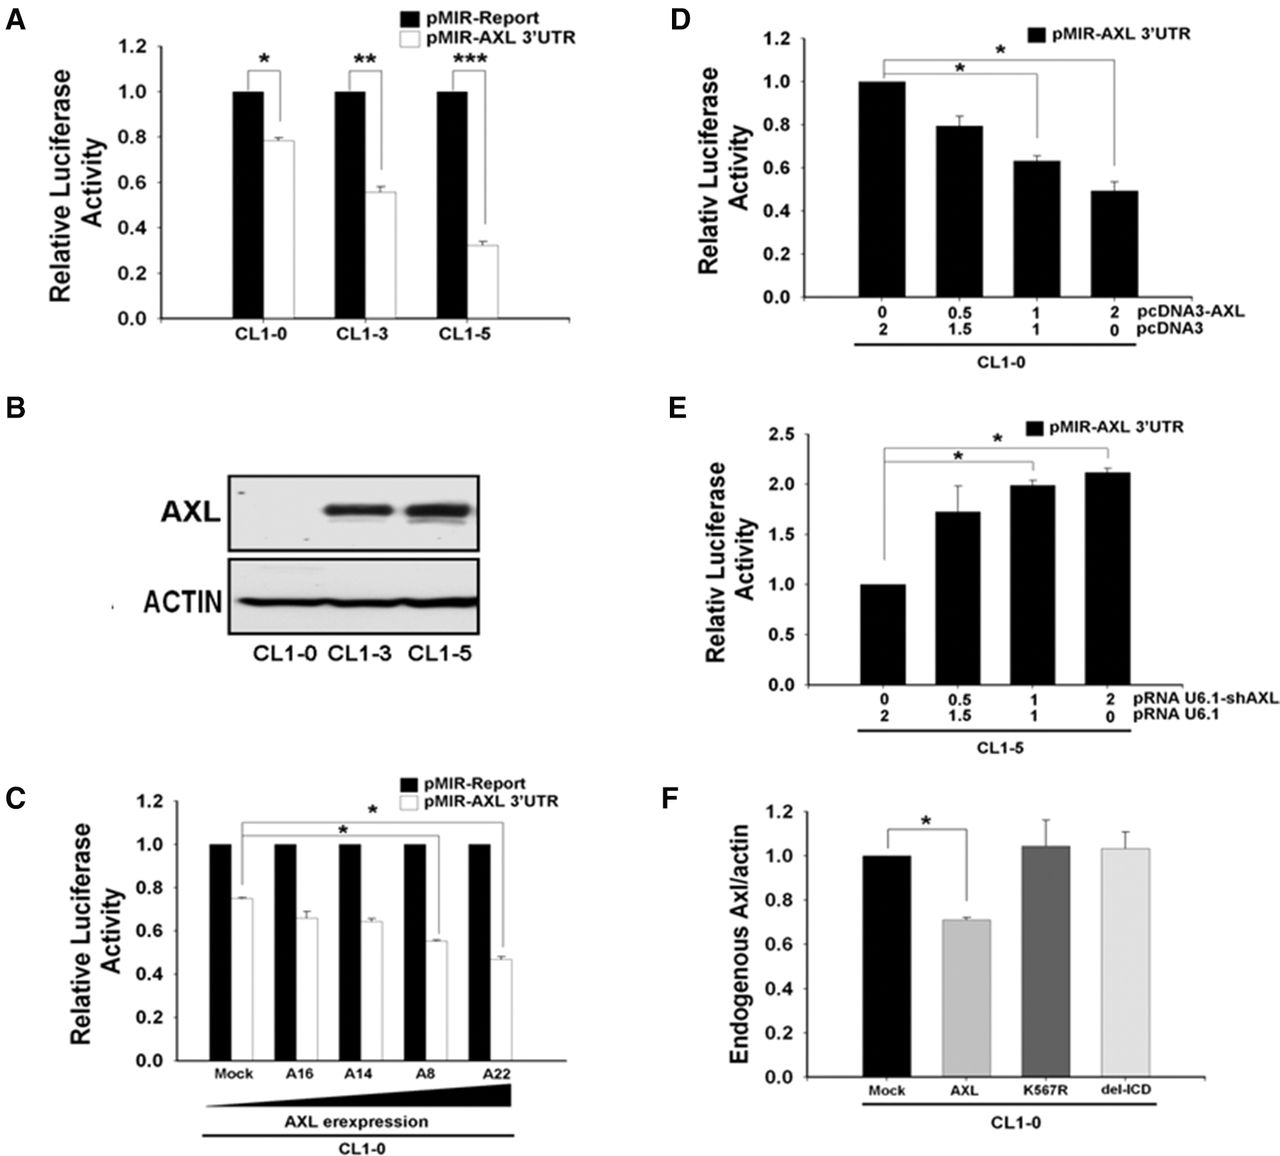
AXL negatively regulates its own expression through 3′ UTR. (A) Inverse correlation between AXL protein level and AXL 3′-UTR reporter activity. The pMIR-Report-AXL 3′-UTR or p-MIR-Report (mock vector) plasmid was cotransfected with Renilla plasmid, serving as an internal control for transfection efficiency, into CL1-0, CL1-3, and CL1-5. After 24 h, luciferase activity of the cell lysates was measured. Relative fold change in luciferase activity for each cell line was plotted with respect to each pMIR-Report control. (B) AXL protein levels of three cell lines at steady state were analyzed by Western blot, using actin as an internal control. (C) AXL 3′-UTR reporter activity in stable transfectants of CL1-0 overexpressing various levels of AXL. CL1-0/Mock is vector alone control. (D) Ectopic expression of AXL suppresses AXL 3′-UTR reporter activity. The AXL 3′-UTR reporter constructs were cotransfected with various amounts of the AXL expression construct in CL1-0 cells, and luciferase activity was measured 24 h later. Equal amounts of DNA (2 μg) were used for each transfection. (E) Knockdown of AXL expression increased the AXL 3′-UTR reporter activity. The AXL 3′-UTR reporter construct was cotransfected with various amounts of the AXL shRNA construct into CL1-5 cells, and reporter activity was measured as above. (F) Endogenous AXL mRNA levels were down-regulated by AXL in a kinase activity-dependent manner. CL1-0 cells were transfected with various AXL constructs. After 48 h, the endogenous AXL mRNA was measured by real-time RT-PCR using actin as an internal control. The ratios of endogenous AXL to actin were calculated. Mock, vector alone; AXL, full-length wild-type; AXL (K567R), kinase-dead; del-ICD, intracellular domain deletion. In A, C, D, E, and F, the values were derived from three independent experiments. Error bars represent SD (*) P < 0.05; (**) P < 0.01; (***) P < 0.001.




