


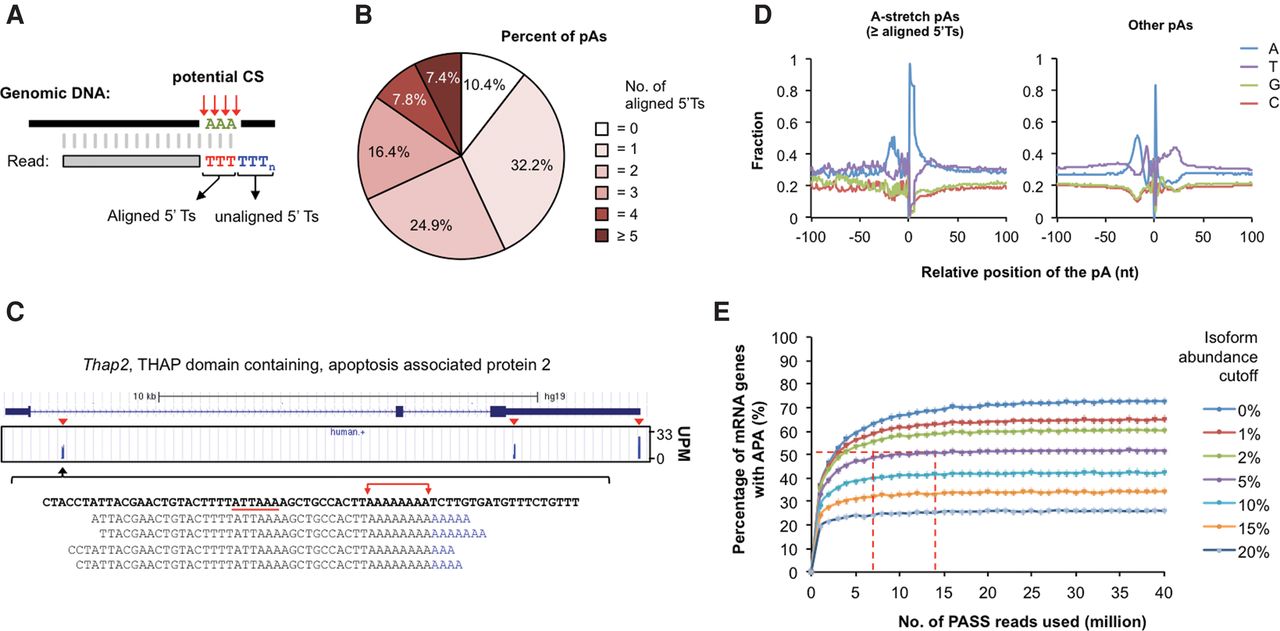
3′READS+ identifies a large number of pAs within A-stretch regions. (A) Schematic showing alignment of a PASS read with an A-stretch region. (B) Distribution of pAs with different A-stretch region sizes (number of aligned 5′T's) using PASS reads from HeLa cells. (C) Nucleotide profiles around the A-stretch and other pAs. (D) An example gene (Thap2) with an A-stretch pA. (Top) Gene structure as shown in the UCSC Genome Browser. (Middle) UPM values for pAs of Thap2. Three alternative pAs are indicated. (Bottom) Sequence surrounding the A-stretch pA. The AUUAAAPAS is underlined, and the A-stretch region is indicated. Several 3′READS+ reads are shown to indicate additional A's used as evidence for the poly(A) tail. (E) Assessment of APA rate in HeLa cells using different numbers of PASS reads and different isoform abundance cutoffs. The plateaued value (51% genes with APA) with the 5% isoform abundance cutoff is indicated by a horizontal line, and two vertical lines indicate seven and 14 million reads, which gave rise to 49% and 51% APA rates, respectively.




