


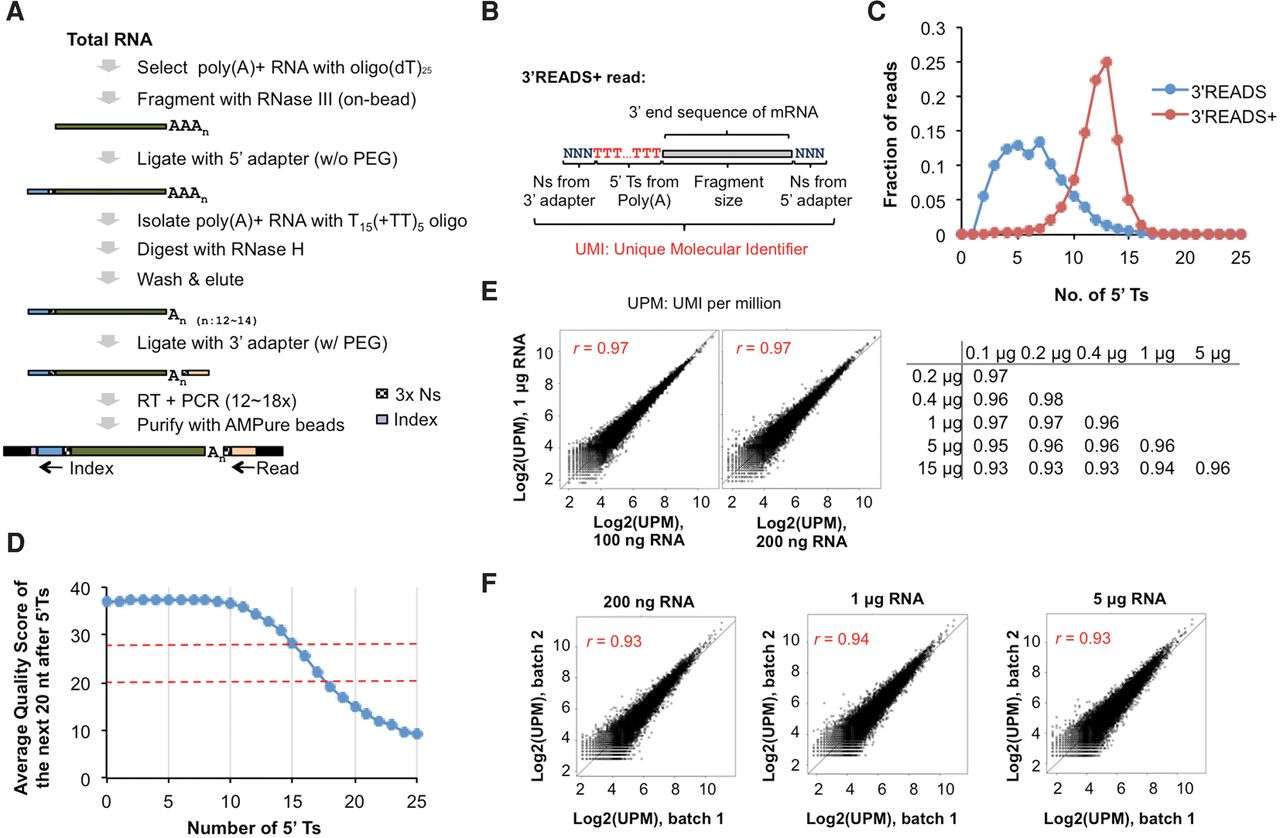
3′READS+. (A) The 3′READS+ protocol incorporating optimized RNase H digestion and ligation steps. AAAn, poly(A) tail; An, shortened poly(A) tail. 5′ adapter, 3′ adapter, random sequences in the adapters (3× N's), and index region in PCR primer are indicated. (B) Schematic showing different parts of a raw read generated by 3′READS+. (C) Number of 5′ T's in reads from 3′READS+ and 3′READS. Only the reads mapped to pAs are shown. (D) Sequencing quality of the bases after 5′T's. (Left) Schematic showing the analyzed region. (Right) The average quality score (QS) of the next 20 bases after 5′T's is shown. QS > 28 is usually considered high quality, whereas <20, low quality. (E, left) Scatter plots comparing log2 (UPM) of transcript between libraries with different amounts of input RNAs. (Right) Table summarizing correlations between different samples. UPM, UMI per million. UMI was based on cleavage site location, number of 5′T's, and the three random nucleotides from the 3′ adapter, as shown in B. Only transcripts with more than five unique PASS reads were used for the plots. Pearson correlation coefficient (r) is indicated in each graph and the table. (F) As in E, except that samples from different batches were compared.




