


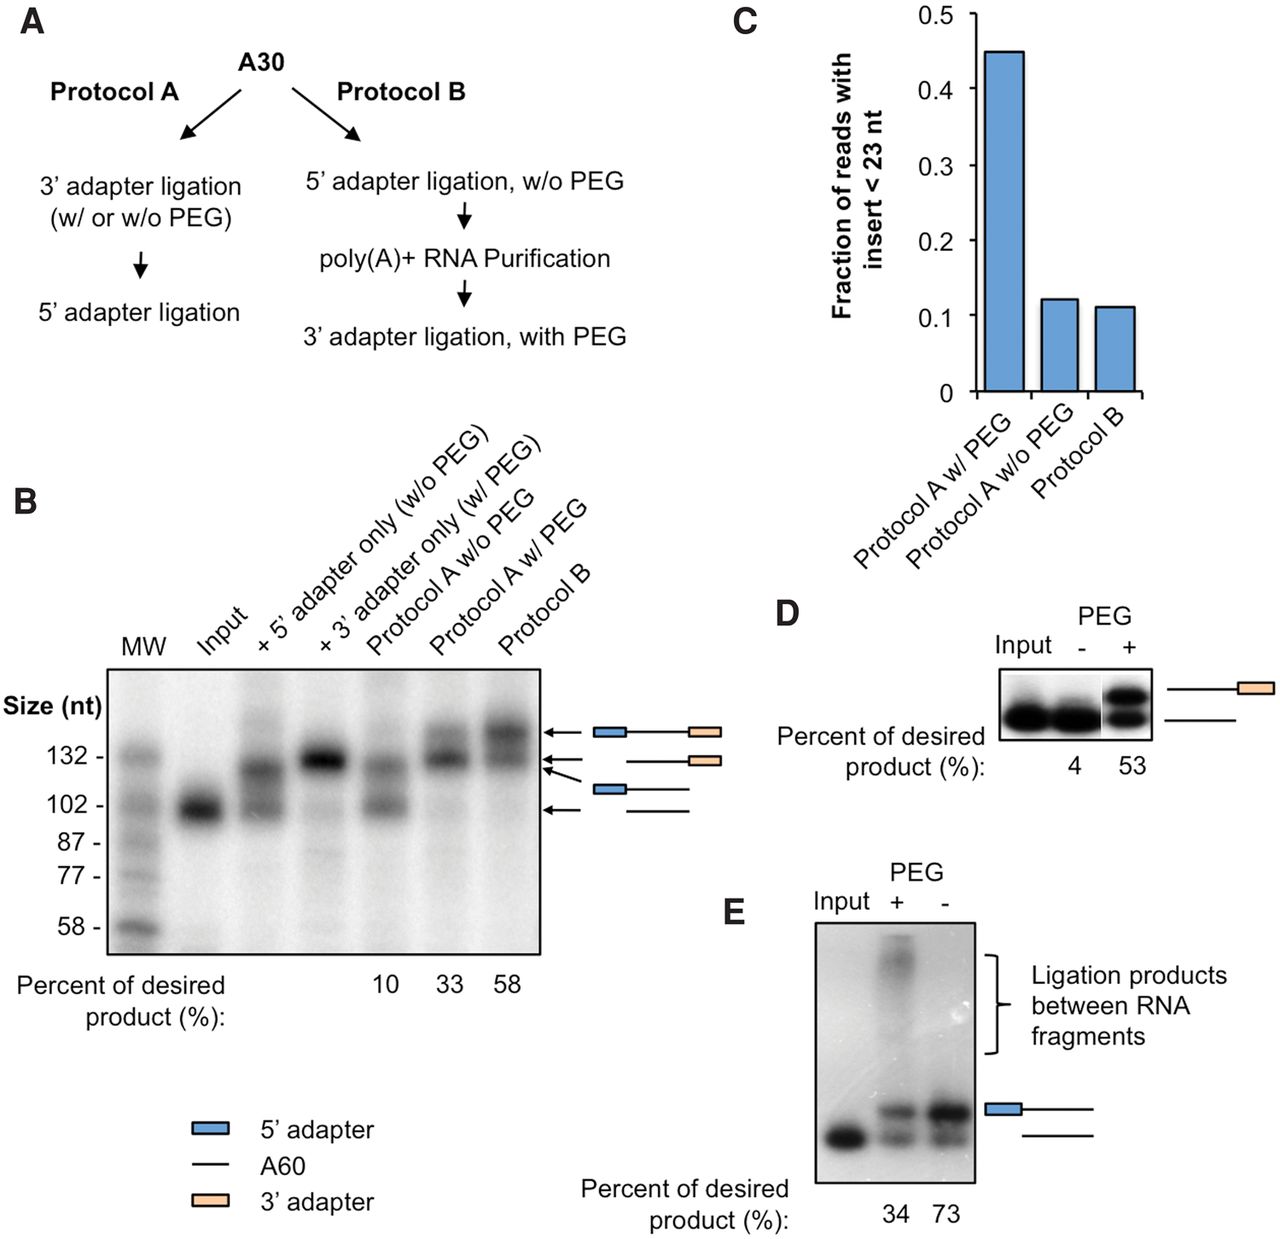
Optimization of 5′ and 3′ adapter ligation steps. (A) Ligation protocols tested. In protocol A, ligation with 3′ and 5′ adapters was performed sequentially in the same tube. The 5′ adapter is an RNA oligo with hydroxyl groups at both 5′ and 3′ ends, and the 3′ adapter is a 5′-adenylated DNA oligo with a 3′ blocker (ddC). In protocol B, 5′ adapter ligation was performed first without PEG, and the ligation product was purified using oligo(dT)25 beads and then ligated to the 3′ adapter in the presence of PEG. (B) Autoradiography showing ligation products using different ligation protocols. MW, molecular weight markers (sizes indicated). Schematics of ligation products and their expected sizes are shown on the right. The percent of product shown below the image is based on the amount of RNA with both 5′ and 3′ adapters relative to that of input RNA. (C) Bar plot showing the fractions of raw reads with inserts <23 nt from the 3′READS libraries prepared with ligation protocol A with (left) or without (right) PEG and with ligation protocol B. (D) Autoradiography showing the effect of PEG on 3′ adapter ligation. RNAs corresponding to the bands are indicated. Percent of product shown below the image is based on the amount of RNA with ligated 3′ adapter relative to that of input RNA. (E) Autoradiography showing the effect of PEG on 5′ adapter ligation. Percent of product shown below the image is based on the amount of RNA with ligated 5′ adapter to that of input RNA.




