


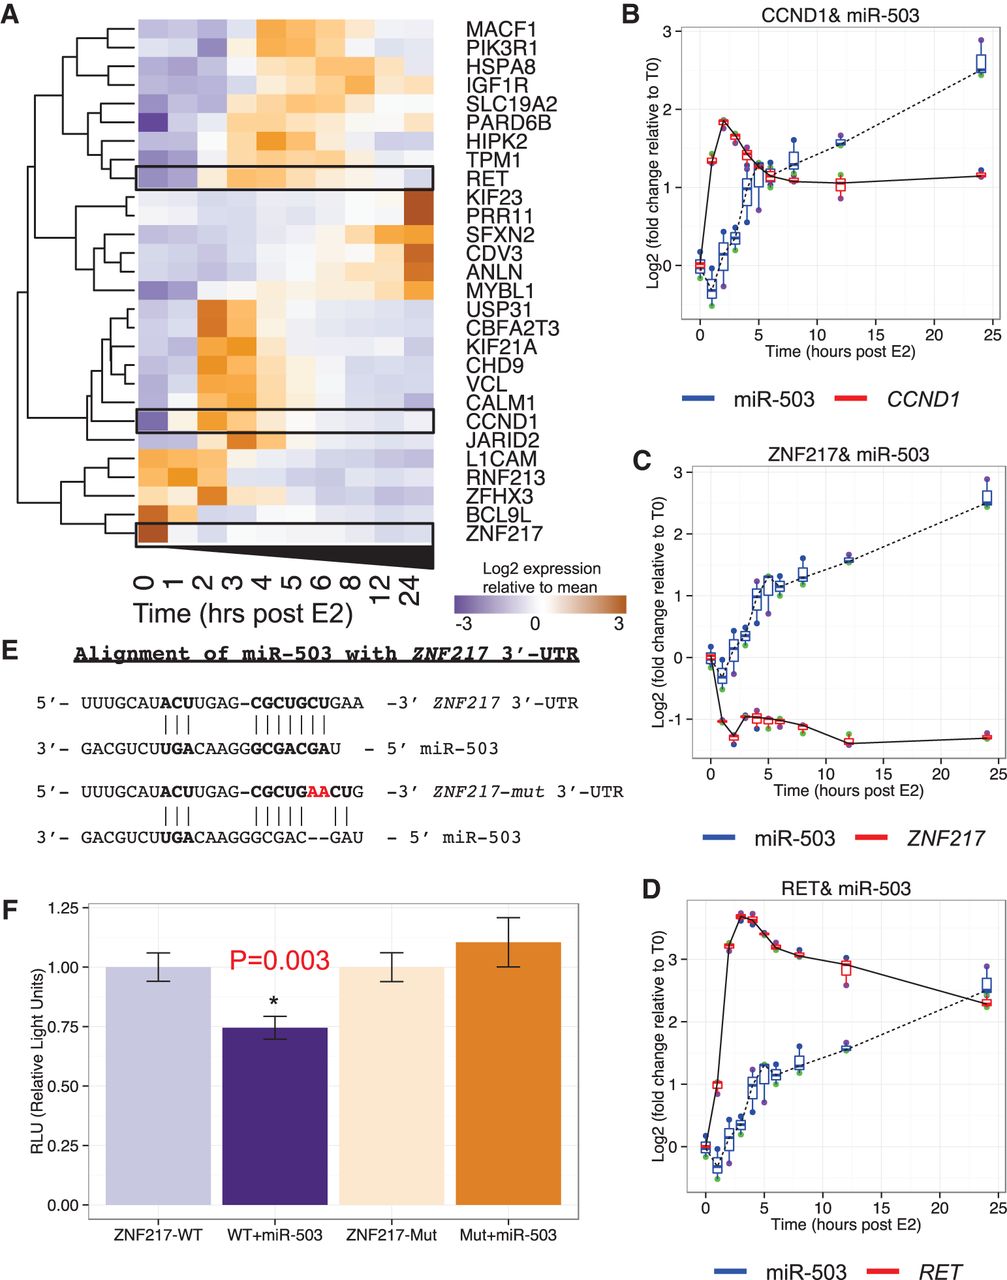
Potential miR-503 targets. (A) The expression profile of 28 miR-503 targets mRNAs that are characteristic of the difference in gene expression between consecutive time points. The expression profiles of miRNAs were clustered using a hierarchical clustering method. (B) Expression profile of miR-503 and validated target, CCND1. (C) Expression profile of miR-503 and predicted target, ZNF217. (D) Expression profile of miR-503 and predicted target, RET. All plots (B–D) show the mean of three biological replicates as a blue line with box and whisker plots showing the variation in log2 (fold change) between replicates. (E) miR-503 target site in the ZNF217 3′-UTR. A dual-luciferase reporter was used to validate the response of ZNF217 to miR-503. The reporter was mutated by inserting two A's (red) to disrupt the seed region binding of miR-503. (F) Response of the ZNF217 reporter and mutant reporter with and without 10 nM miR-503 mimic. Significance assessed using a Student's t-test.




