


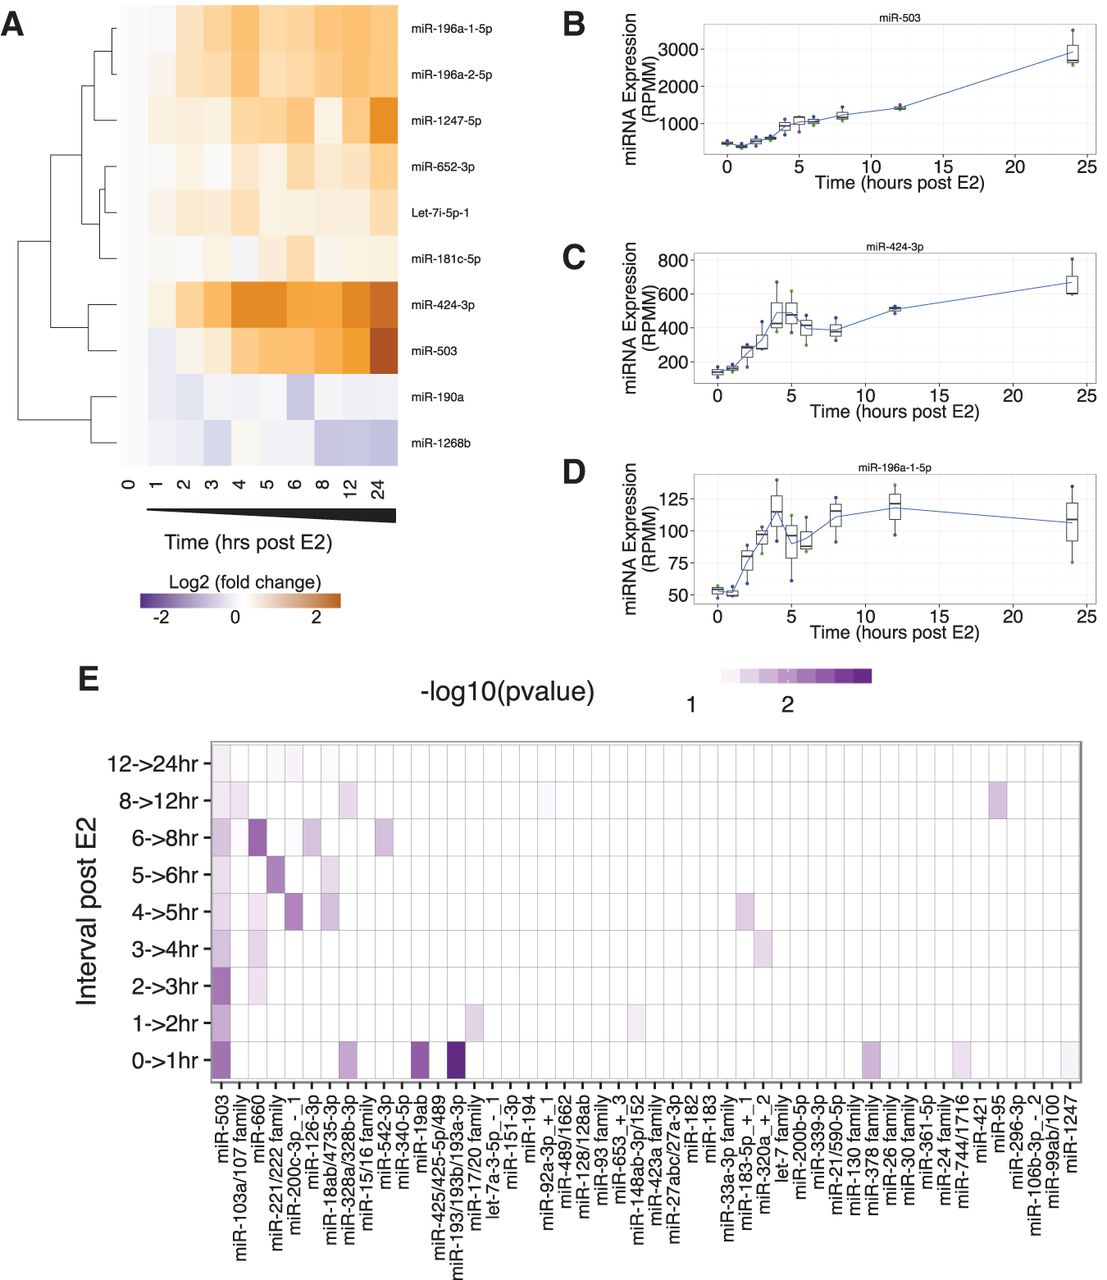
miRNA expression response to estrogen stimulation. (A) The expression profile of 10 miRNAs that have a ≥1.5 mean fold change of at least one time point in response to estrogen stimulation and a mean normalized expression of at least 50 RPMM. The expression profiles of miRNAs were clustered using a hierarchical clustering method. (B) Expression profile of the strongest responding miRNA, miR-503. (C) Expression profile of miR-424-3p. (D) Expression profile of miR-196a-1-5p. All plots (B–D) show the mean of three biological replicates as a blue line with box and whisker plots showing the variation in normalized expression among the replicates. (E) This plot shows the −Log10(uncorrected P-value) of enrichment for each miRNA family among the genes that is characteristic of the change in expression between each time interval. miRNA families on the x-axis are sorted by decreasing significance (sum across all time intervals).




