


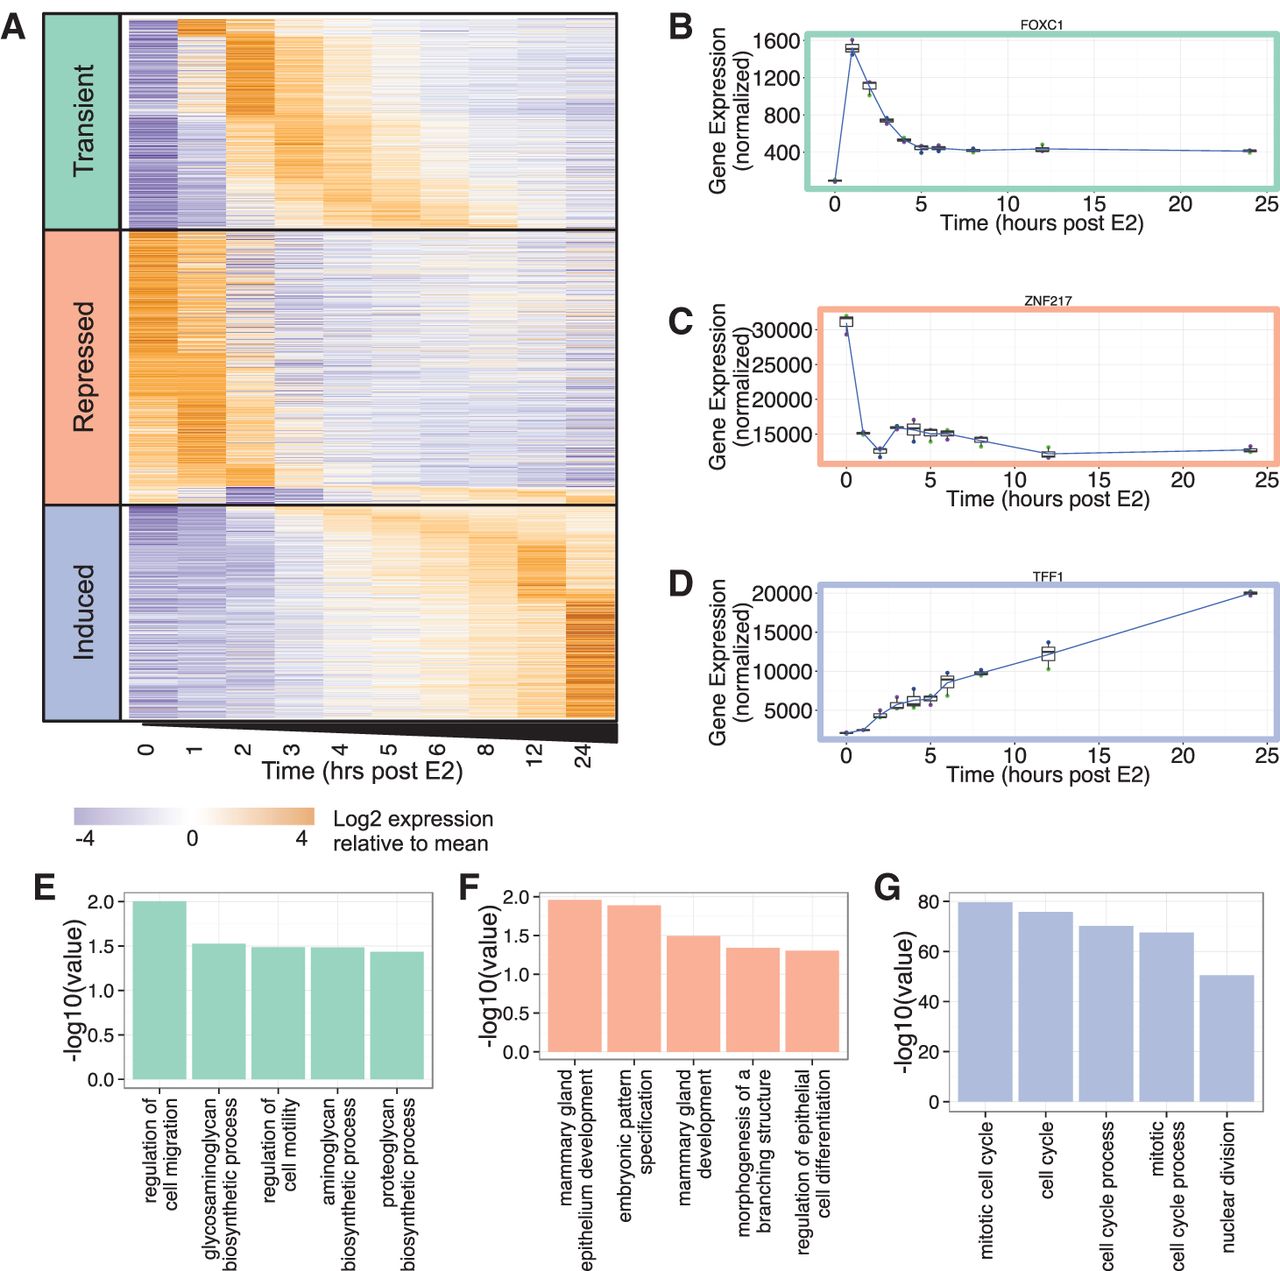
Gene expression response to estrogen stimulation. (A) The expression profile of 1546 mRNAs that have a significant (adjusted P-value <0.05) greater than or equal to twofold change at one or more time points in response to estrogen stimulation, and a mean normalized expression of at least 500 across the time series. Genes are clustered into three classes (transient, repressed, and induced). (B) Expression profile of FOXC1, an example of a transient gene. (C) Expression profile of ZNF217, an example of a repressed gene. (D) Expression profile of TFF1, an example of an induced gene. All plots show the mean of three biological replicates as a blue line with a box and whisker plot showing the variation in normalized expression among the replicates. (E) Selected results from Gene Ontology analysis of genes in the transient class. (F) Selected results from Gene Ontology analysis of genes in the repressed class. (G) Selected results from Gene Ontology analysis of genes in the induced class.




