


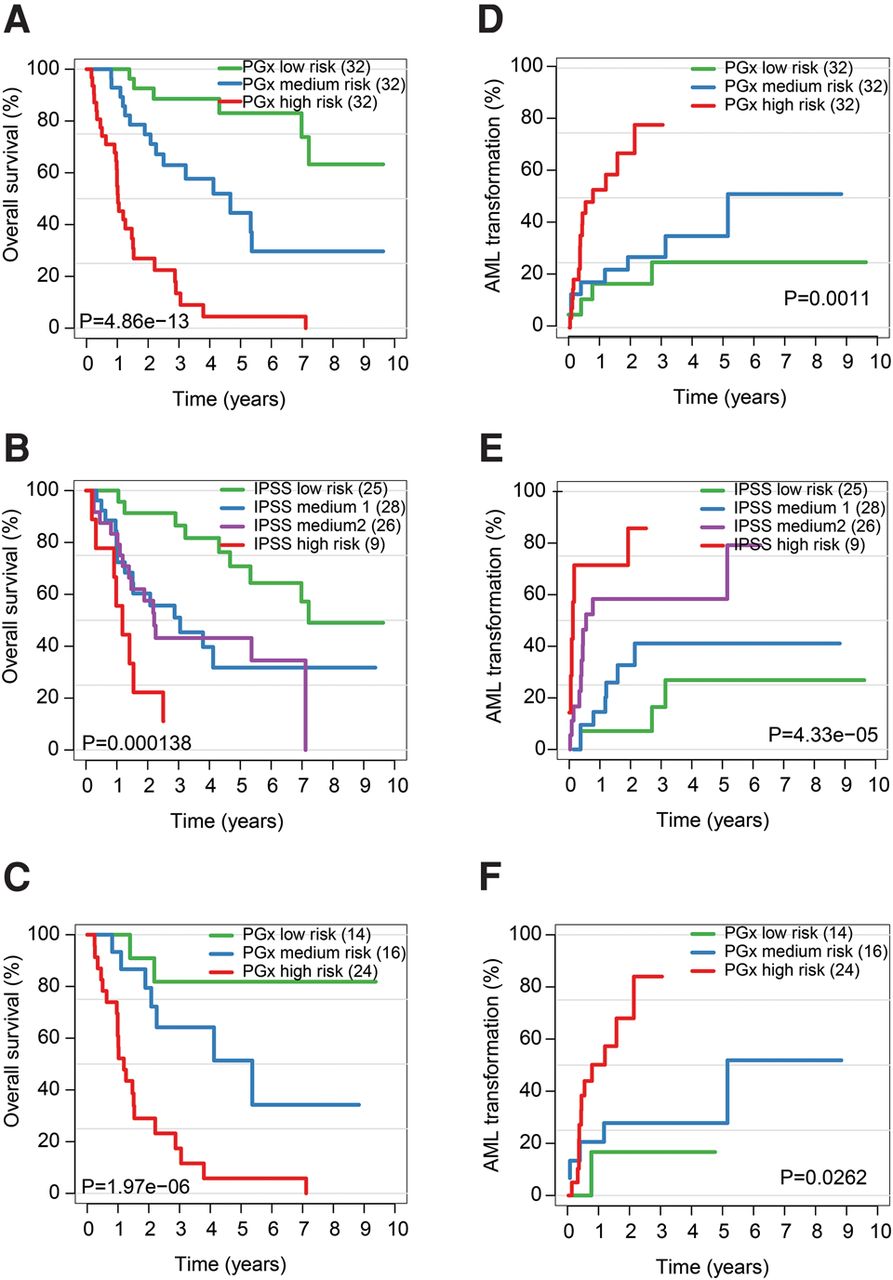
A critical splicing signature linked to MDS prognosis. (A) Kaplan–Meier curve for overall survival demonstrating how application of the MDS-PGx score efficiently stratifies MDS patients into three distinct risk groups. (B) Overall survival curves for the same patients stratified by the IPSS show substantial overlap in the intermediate risk groups. (C) IPSS Intermediate-1 and Intermediate-2 risk patients (from B) were further stratified by the MDS-PGx score. (D) Time to AML transformation is shown for MDS patients stratified by the MDS-PGx score. (E) Time to AML transformation is shown for MDS patients stratified by their IPSS risk group. (F) Time to AML transformation of IPSS Intermediate-1 and Intermediate-2 risk patients (from E) reclassified by the MDS-PGx score.




