


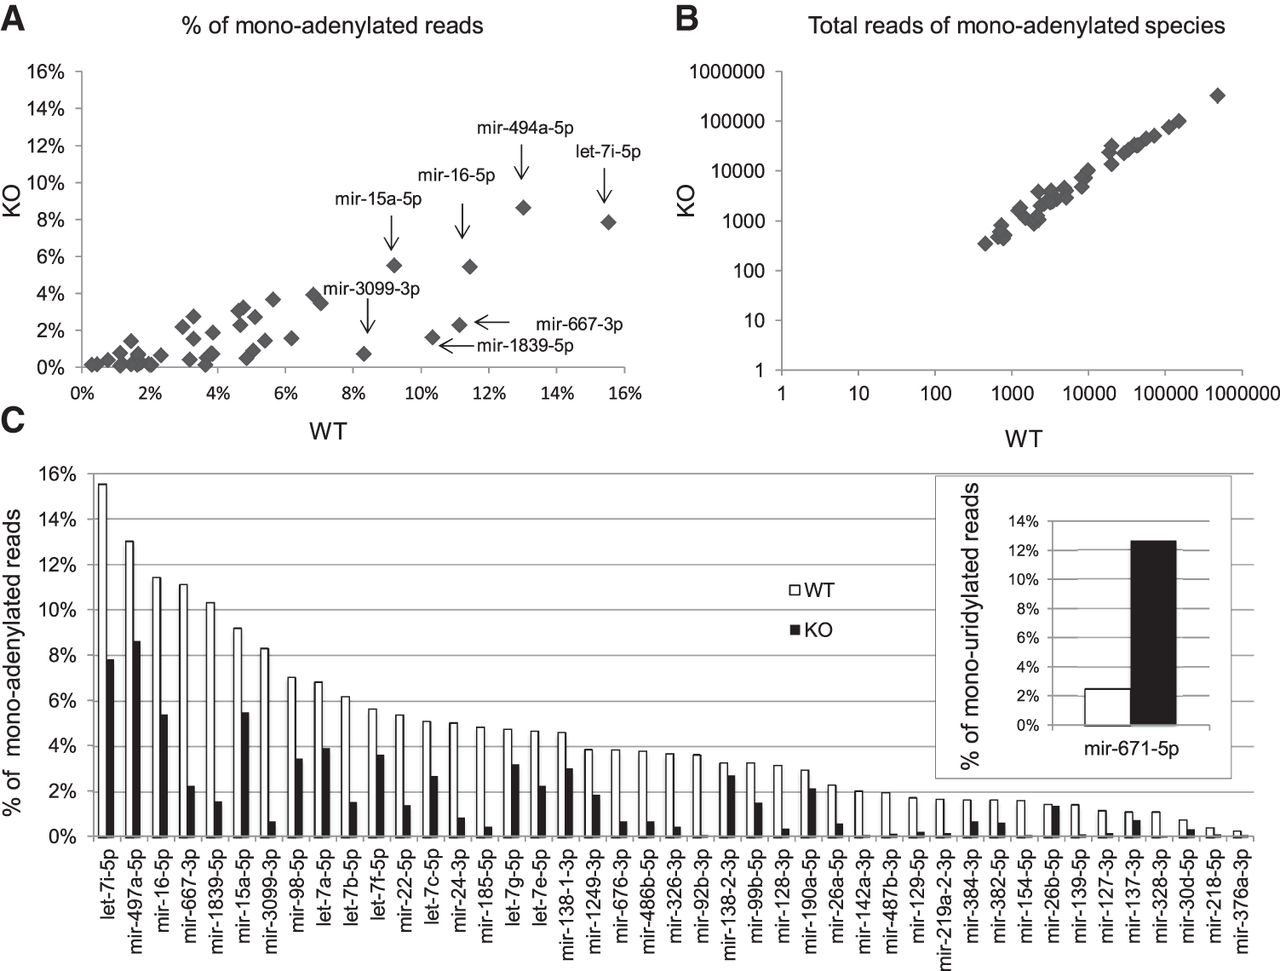
FIGURE 1.
Gld2 controls miRNA monoadenylation. (A) Scatter plot of mean percentages of 3′ monoadenylated counts for 43 miRNAs in six WT and six Gld2 KO hippocampi. (B) Scatter plot on log scale of the steady-state levels (average read counts) of 43 specific hippocampal miRNAs that are differentially 3′ monoadenylated in WT and Gld2 KO mice as identified in panel A. (C) Bar plot representation of panel A showing mean percentages of 43 specific miRNAs that are differentially monoadenylated in WT and Gld2 KO hippocampus (all have a P-value <0.05; Mann-Whitney U-test). (C, inset) Mean percentages of mir-671-5p that are monouridylated in Gld2 KO hippocampus (P-value <0.05).




