


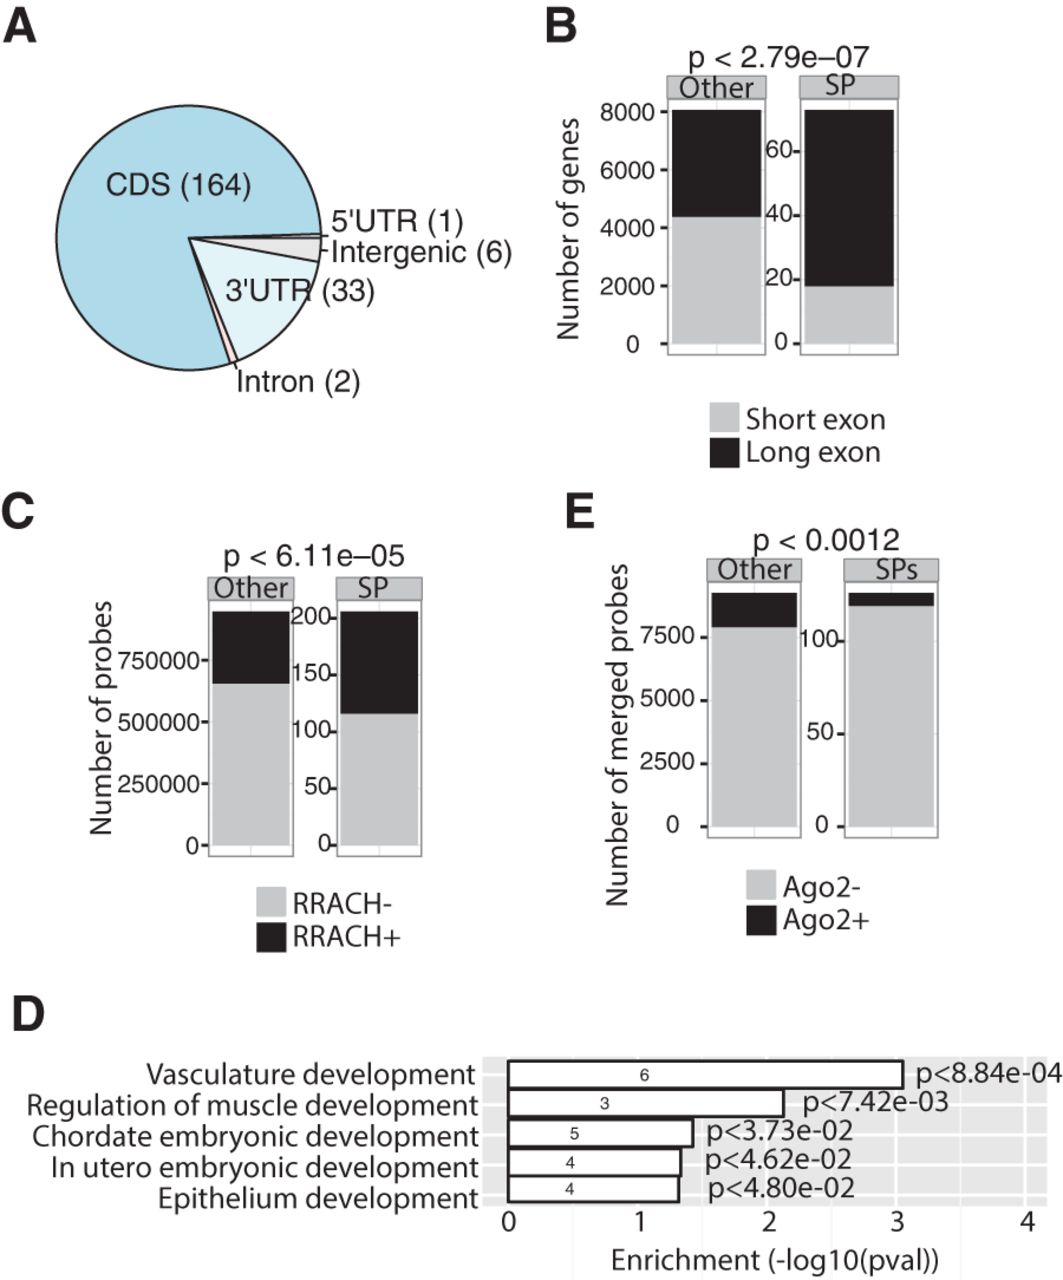
FIGURE 4.
m6A interferes with A–U or A–T pairing. (A) Pie chart indicating genic location of significant probes (SPs). (B) Bar plots show specific enrichment of SPs on long (>300 nt) versus short (≤300 nt) exons (P < 2.79 × 10⁻⁷; Fisher's exact test). (C) Bar plots showing enrichment of the RRACH motif within 206 SPs and remaining probes (P < 6.11 × 10⁻⁵; Fisher's exact test). (D) GO analysis of 64 protein-coding genes containing SPs (P < 0.05). The number of gene hits in a GO category is indicated within the bars. (E). Bar plots showing that meRIP-seq peaks containing SPs exhibit significantly decreased binding to AGO2 than do those from remaining probes. Fisher's exact test, P < 0.0012.




