


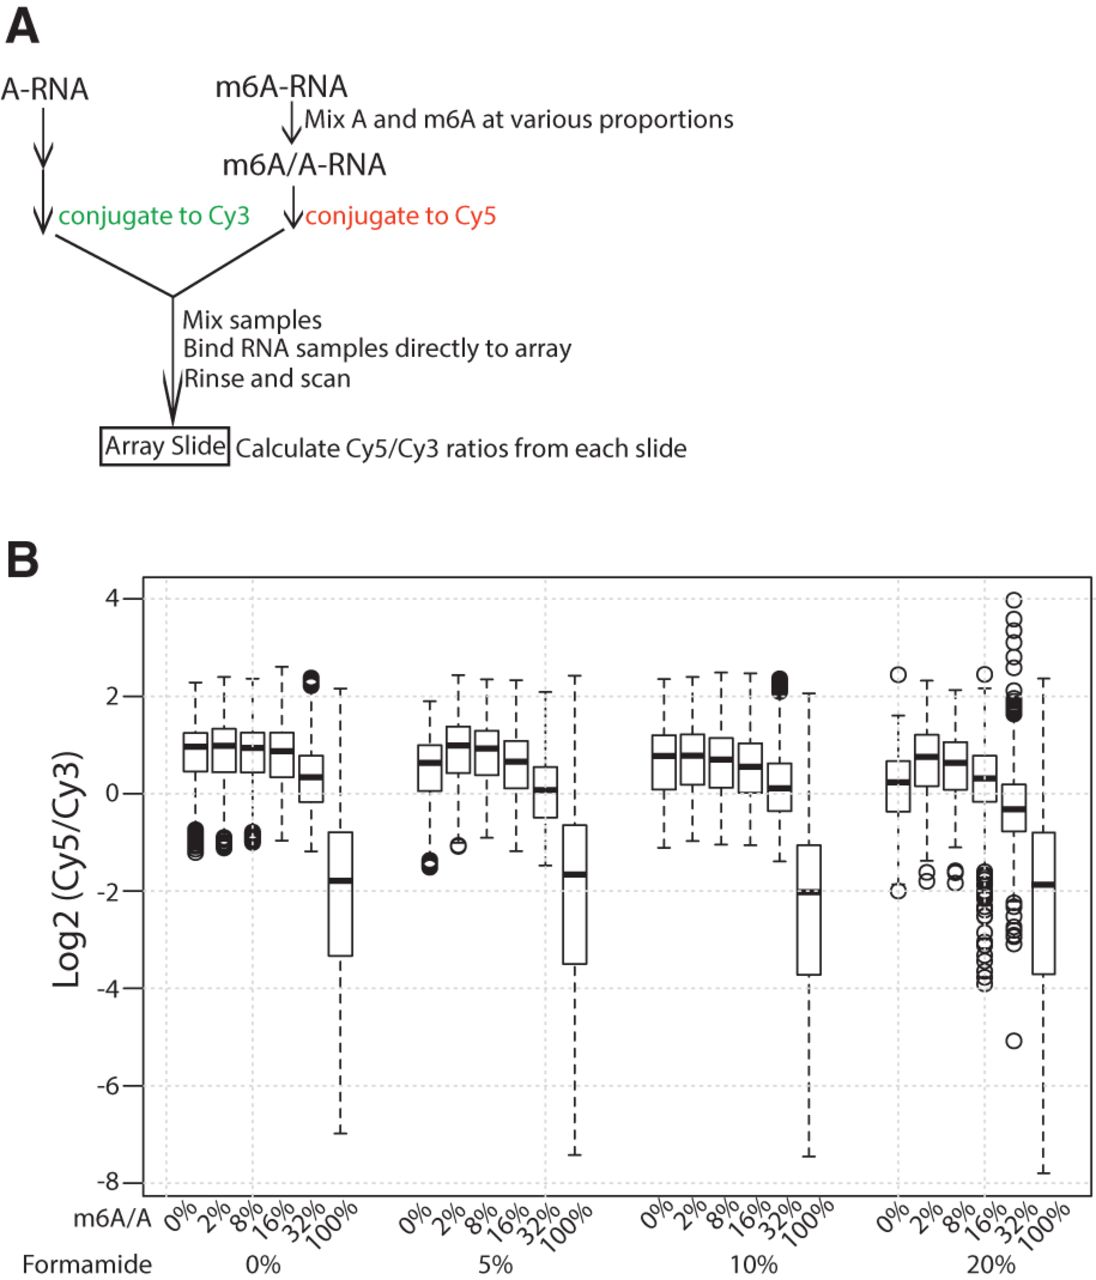
FIGURE 2.
m6A is detected by a two-color microarray. (A) Schematic drawing of pilot array experiment. In vitro-synthesized A-RNA or different mixed m6A/A-RNA samples were labeled with Cy3 or Cy5, respectively. Cy3 and Cy5 samples were mixed and directly hybridized to an Agilent two-color tiling array, and Cy5/Cy3 signal ratios were calculated. (B) Overall Cy5/Cy3 signal ratios of A versus m6A/A mixed RNAs. Signal intensities in the Cy5 channel correspond to a RNA population that lacks m6A (i.e., background).




