


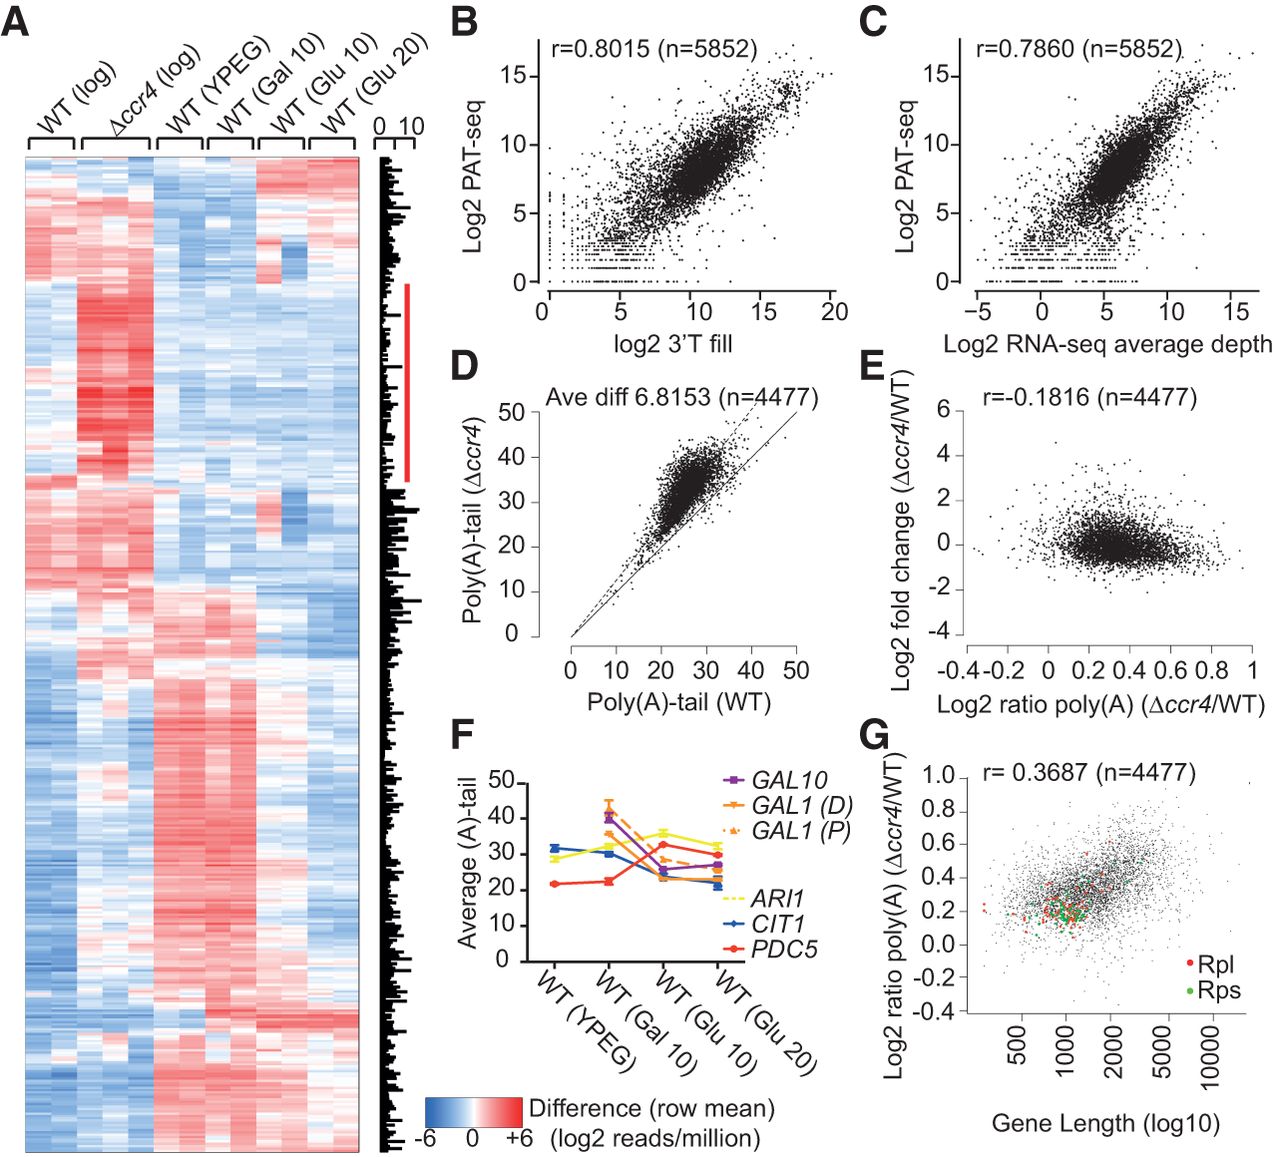
PAT-seq for DGE and polyadenylation state. (A) Differential expression of peaks (adenylated sites) with greater than sixfold change in expression line average and ≥10 reads. The red bar indicates normally silent genes deregulated in the Δccr4 mutant. (B) The Pearson's correlation between PAT-seq read count and 3′ T-fill. Each black spot represents one of n genes. (C) The correlation between PAT-seq read count and the per gene average depth of coverage by RNA-seq. (D) The correlation between the average (per gene) andenylation-state of the Wt and the Δccr4 transcriptomes. The solid line indicates the line of tail-length parity; the dashed line indicates the average change in adenylation-state ratio between the wild-type and the Δccr4 transcriptome. (E) The correlation between tail-length change and expression-level change between the wild-type and the Δccr4 transcriptome. (F) The adenylation-state change in average tail sequenced for candidate mRNA during the metabolic shift. The change is homo-directional to gene expression change. (G) The correlation between transcript length and adenylation-state ratio (Δccr4 versus wild type). Large ribosomal subunit genes are marked red, and small ribosomal subunit genes are green in the figure on the right. Note: All data presented have an associated P value <0.0001.




