


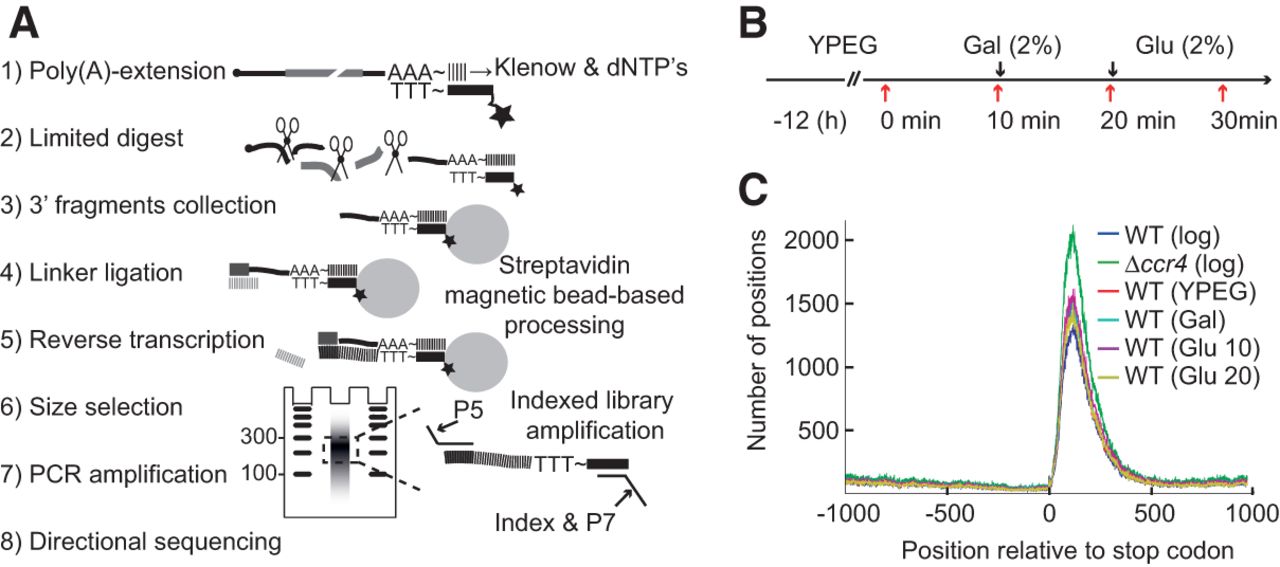
FIGURE 1.
Poly(A)-Test sequencing. (A) Schematic representation of the PAT-seq approach. (B) Schematic of the experimental approach for the Crabtree Warburg metabolic shift of yeast cells transitioning from respiratory to fermentative growth. Red arrows indicate times of cell harvest; YPEG, Gal, and Glu refer to ethanol/glycerol, galactose, and glucose as carbon source. (C) The position of each adenylation site relative to the annotated transcript stop codon (0). Note the peak position for adenylation sites is ∼100 bases after the stop. The increased number of positions in the Δccr4 sample derives from loci that are silent in the wild-type strain.




