


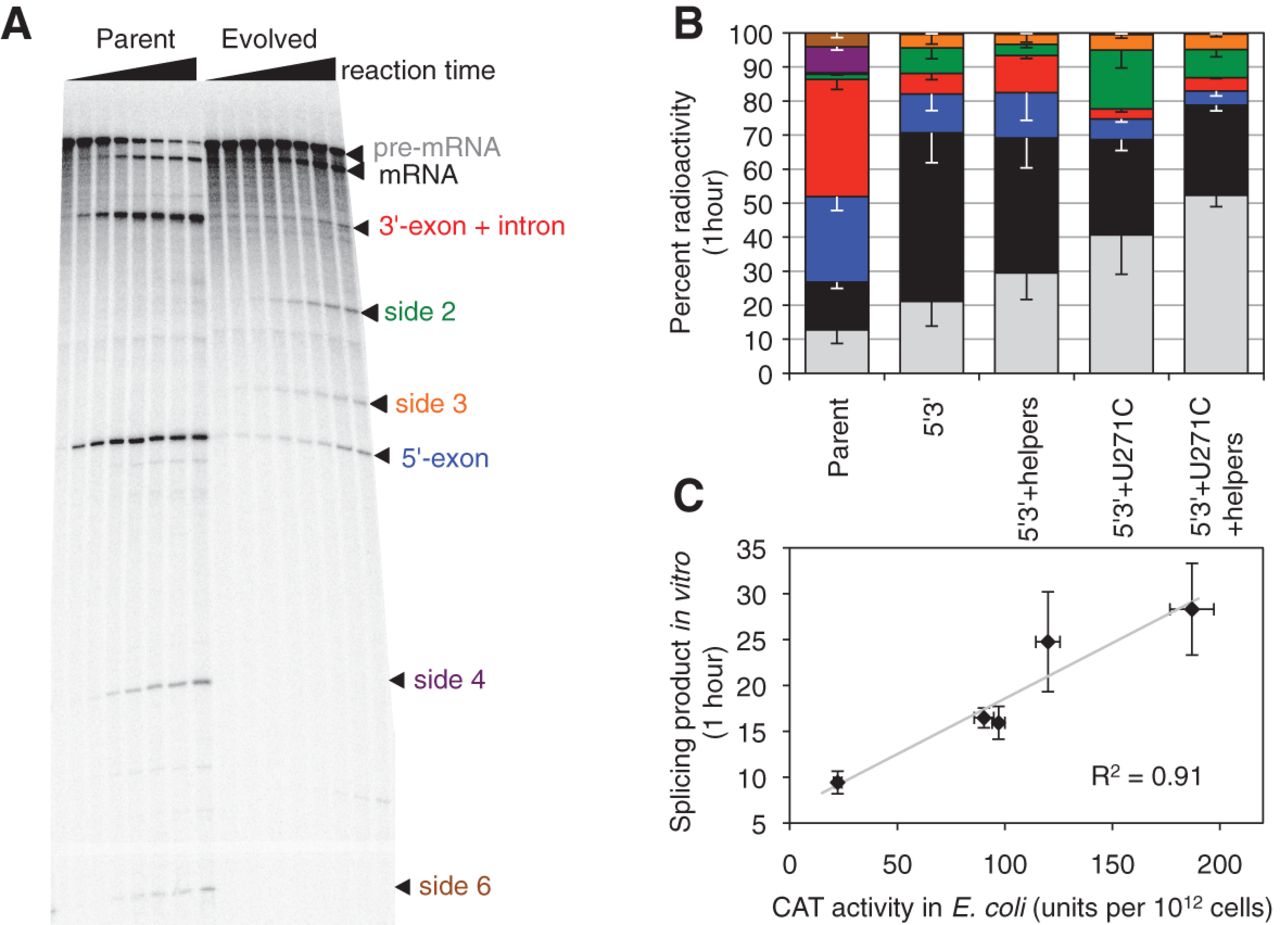
Effect of evolved spliceozyme mutations on the product pattern of in vitro splicing reactions. (A) Phosphorimage of radiolabeled splicing products with two different spliceozymes, separated by denaturing polyacrylamide gel electrophoresis. The left time course shows the products from the parent spliceozyme; the right time course shows the products from the evolved spliceozyme W11 (5′3′ + U271C + helpers). The time points are 0, 1, 2, 5, 10, 20, 30, and 60 min. The identity of the bands is given on the right. (B) Effect of evolved mutations in the spliceozyme on the product pattern of in vitro splicing reactions. The percentage of radioactivity in specific bands is plotted as a function of the spliceozyme construct, at a reaction time of 60 min. For a graph including all reaction times, see Supplemental Figure S4. Unreacted pre-mRNA (gray) is converted to mRNA (black). Cleavage products at the 5′-splice site are colored in blue (5′-exon) and red (3′-exon with intron). Additional side products are side2 (green), side3 (orange), side4 (purple), and side6 (brown). Error bars are standard deviations from three reactions. Note that the ribozyme variant labeled 5′3′ + U271C + helpers is identical to the evolved clone W11. (C) Correlation between product formation in vitro with CAT activity in E. coli cells. None of the other in vitro products was correlated similarly well with CAT activity or cell growth on chloramphenicol containing medium. Error bars are standard deviations from three experiments.




