


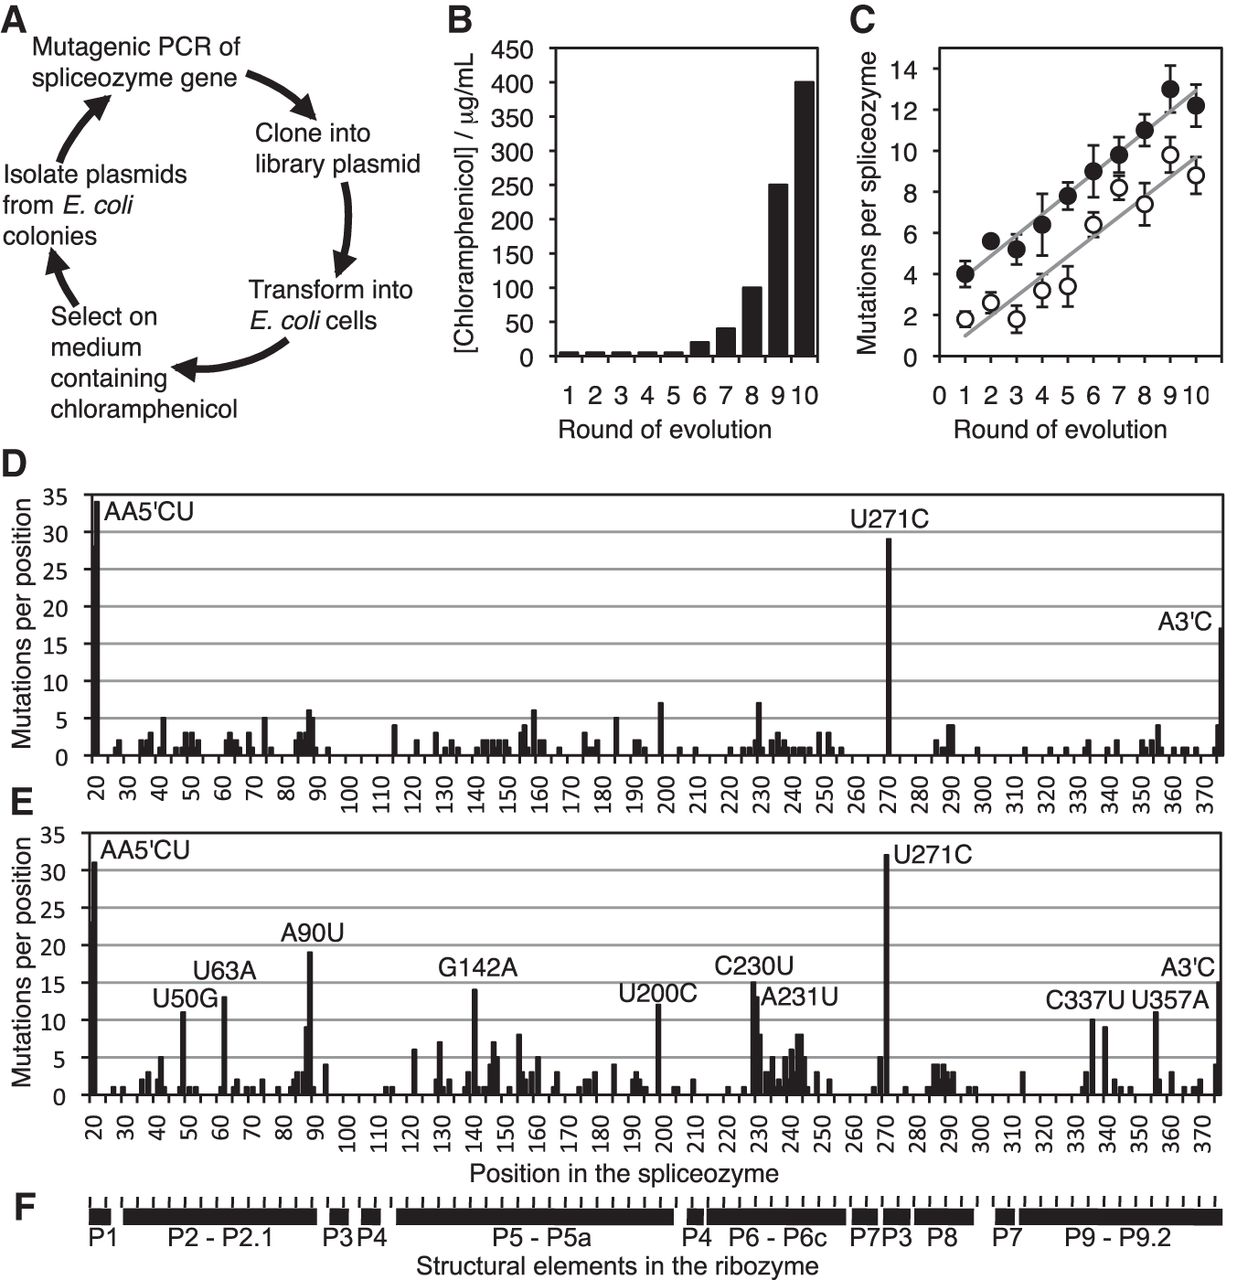
Evolution of spliceozymes in E. coli cells. (A) Schematic of the evolution procedure. (B) Selection pressure as a function of the rounds of evolution. The concentration of chloramphenicol was 5 μg/mL for the first five evolution rounds. Both lines of evolution were subjected to the same profile. (C) Average number of mutations per spliceozyme sequence over 10 rounds of evolution. Empty circles show the mutations in the evolutionary line starting from the wild-type sequence (W), and filled circles the mutations in the evolutionary line starting from a pre-evolved pool (P). Linear fits resulted in a slope of 0.97 for line W, and 1.01 for line P. The y-axis offset was 0.0 for line W, and 2.9 for line P. Error bars are the uncertainties of the mean from five sequences (rounds 1–9), or 10 sequences (round 10). (D) Positions of the mutations in the spliceozyme sequence for line W, summed over 10 rounds of evolution. The height of each column is the number of mutations per position within 55 sequences. Mutations that occurred at least 10 times are annotated with the mutation that occurred most frequently. Mutations at the spliceozyme 5′ terminus and 3′ terminus are labeled with 5′ and 3′, respectively. (E) As in D but for line P. (F) Secondary structure elements of the spliceozyme, aligned with the nucleotide positions in the graphs of D and E.




