


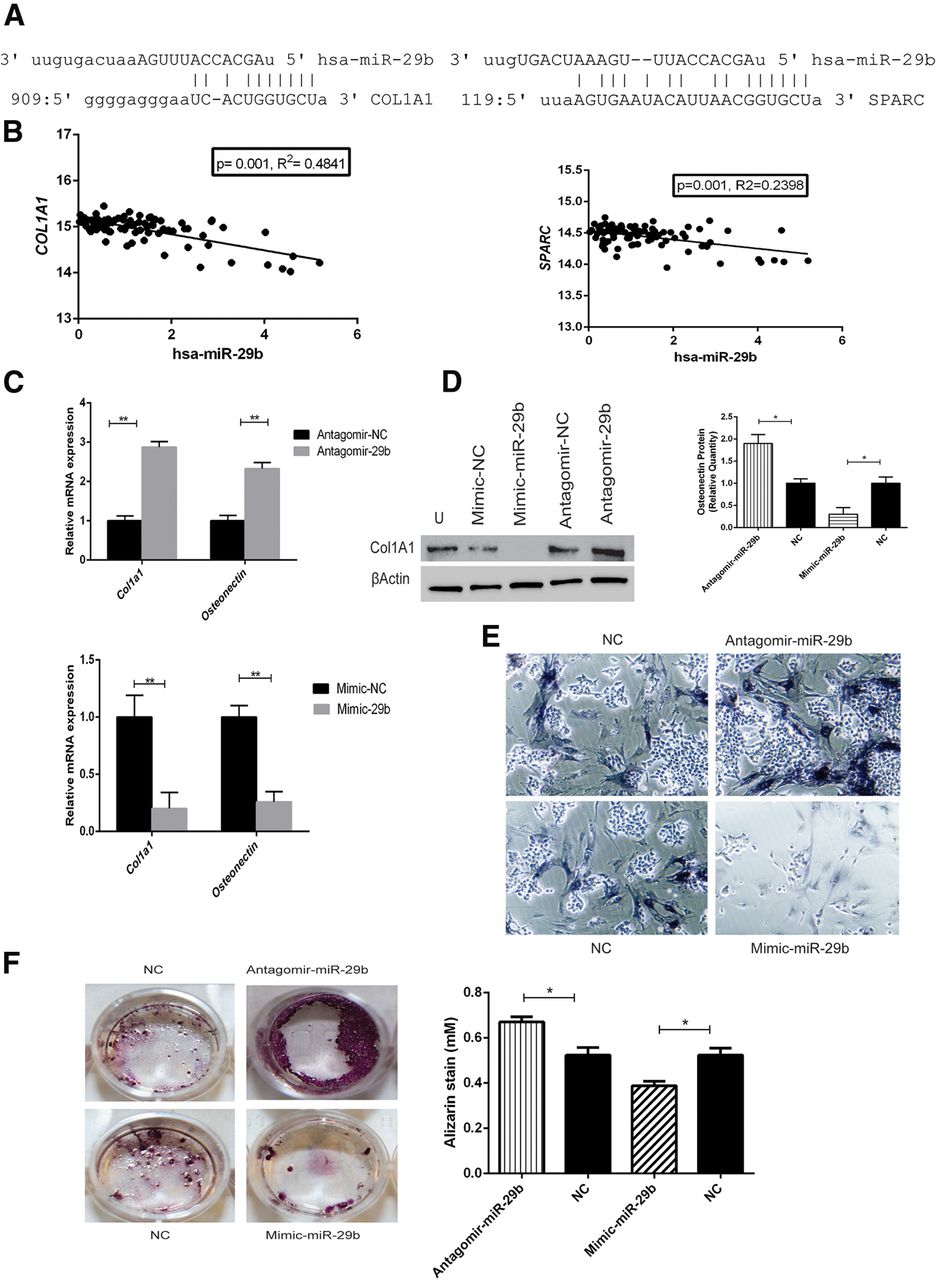
hsa-miR-29b negatively regulates Col1A1 and SPARC in primary human bone cells. (A) Predicted binding sites for miR-29b in Col1A1 and SPARC 3′ UTR by the TargetScan, miRanda, and PicTar softwares. (B) Pearson correlation scatter plots showing a negative correlation between hsa-miR-29b and COL1A1 (P = 0.001) and with SPARC (P = 0.001). (C) RT-PCR analysis of COL1A1 and SPARC mRNA levels normalized to GAPDH. (D) The amount of COL1A1 protein was assessed by Western blot analysis with β-actin as a loading control (left panel) and SPARC protein secreted into conditioned media was quantified by Western blot. Mean ± SD * is significantly different from negative control (NC) (right panel). (E) ALP staining was visualized at 10× magnification. (F) Deposition of calcium was visualized (left panel) and quantified (right panel), by Alizarin red stain in HOBs after they were treated in osteogenic medium but for 12 d.




