


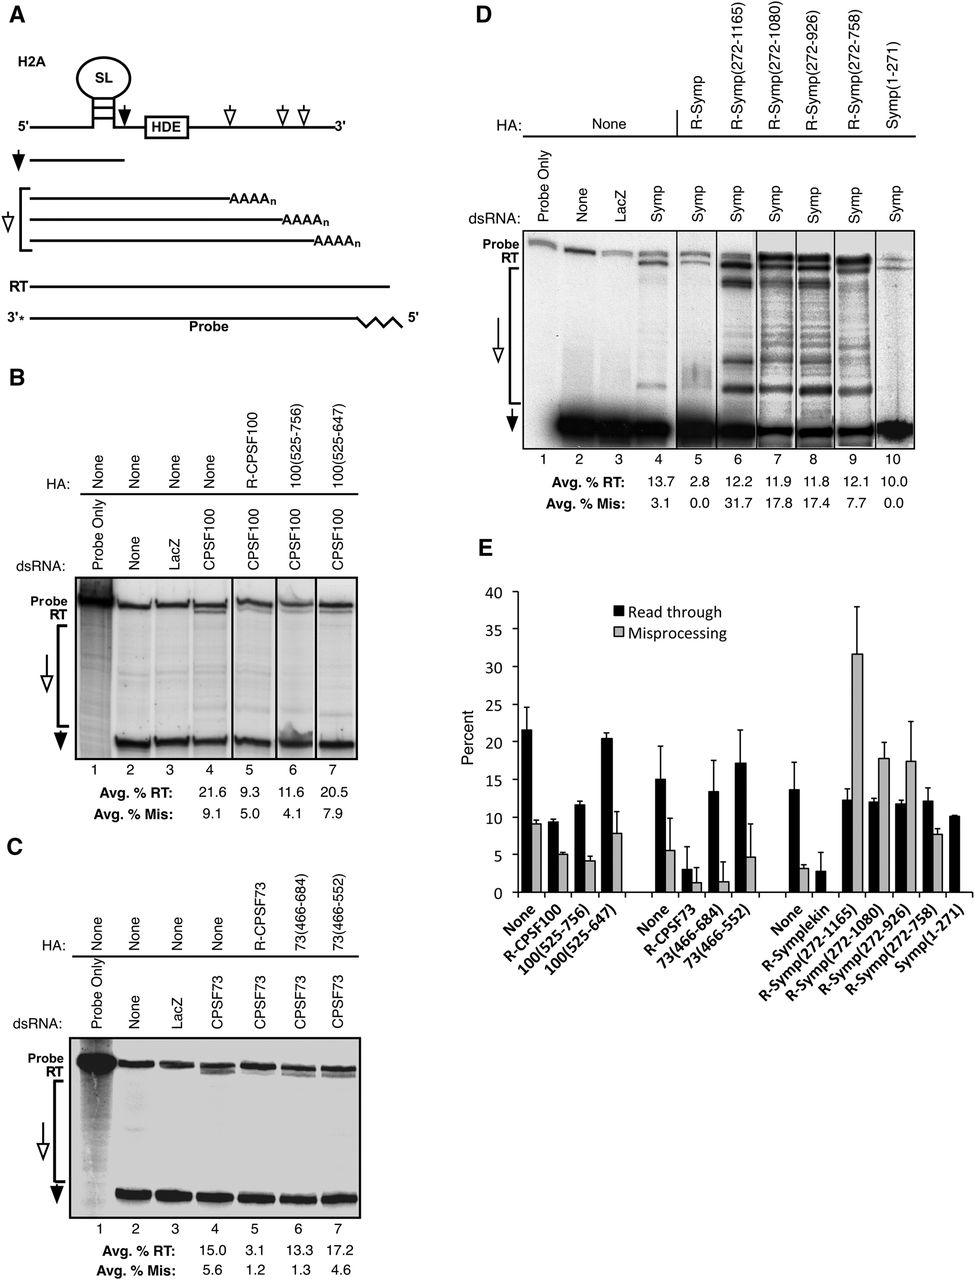
CCCs with Symplekin C-terminal residues can use downstream poly(A) sites for H2A mRNA 3′ end processing. (A) A schematic of the histone 2A (H2A) mRNA 3′ end is shown. Cis elements required for proper processing are the stem–loop (SL) and the histone downstream element (HDE). The appropriate cleavage site and the properly processed H2A 3′ end are marked with filled arrows. Downstream cryptic polyadenylation signals and misprocessed products resulting from use of these signals are labeled with open arrows. If neither the proper cleavage site nor cryptic polyadenylation signals can be used for processing, an extended 3′ UTR product results (RT). The 3′ end labeled DNA S1 nuclease assay probe will hybridize to all of these products. The 5′ 20 nt of the probe (zig-zag line) cannot anneal to the H2A 3′ end products. (B) H2A 3′ ends in Dmel-2 cells containing wild-type and mutant CPSF100 CCCs and control cells were visualized using a S1 nuclease assay. Addition of dsRNA is indicated just above the gel while expression of either full-length or mutant CCC components is described above the solid line. Gel positions of potential products are marked on the left with the same labeling as in (A). (C) H2A 3′ ends in Dmel-2 cells containing wild-type and mutant CPSF73 CCCs and control cells were visualized using a S1 nuclease assay. The gel is labeled as in (B). (D) An S1 nuclease assay was performed to visualize endogenous H2A mRNA 3′ ends in Dmel-2 cells with Symplekin mutant CCCs. The gel is labeled as in (B). (E) The percentages of RT, misprocessed, and properly processed H2A mRNAs were calculated for two independent experiments. The averages of RT and misprocessed products for each experiment were plotted with the corresponding standard deviation and the values are indicated below each gel. The black bars are the percent of RT product while the gray bars represent percent misprocessed H2A mRNA.




