Profiling ribonucleotide modifications at full-transcriptome level: a step toward MS-based epitranscriptomics

(Downloading may take up to 30 seconds. If the slide opens in your browser, select File -> Save As to save it.)

Click on image to view larger version.

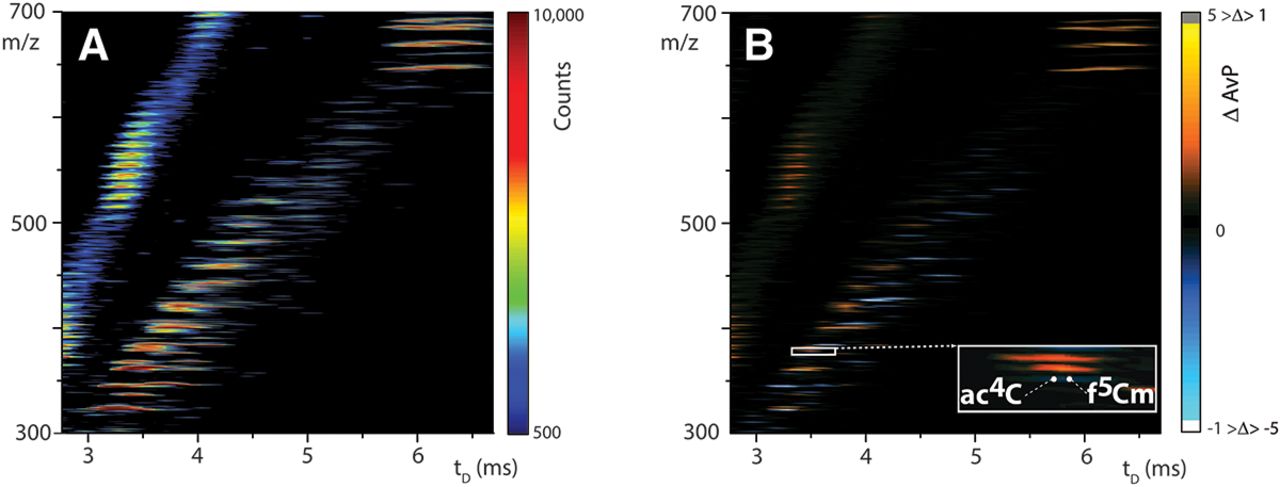
FIGURE 5.
FIGURE 5.

(A) Anionic IMS-MS heat-map obtained from S. cerevisiae grown in synthetic complete (SC) medium. (B) Differential plot obtained by subtracting the plot in A from the one provided by S. cerevisiae grown YPD medium (Fig. 2).

This Article

  1. RNA 21: 1361-1374

